Data Statistics
Note: This feature was introduced in firmware v4.9.
Some models, such as Mango 2 (GL-MG1300), do not support Data Statistics due to insufficient memory, even when running firmware v4.9 or later. Please refer to Supported Models for details.
On the left side of the web Admin Panel, go to FLOW CONTROL -> Data Statistics.
Data Statistics provides an intuitive traffic dashboard that identifies network usage by application and protocol. It supports viewing 1‑hour, 1‑day, and 7‑day historical trends, displays usage rankings, monitors per‑device traffic, and allows one‑click blocking of unwanted apps.
Note:
- Data Statistics will not take effect when the router is in Drop-in Gateway mode.
- Data Statistics cannot work with Network Acceleration. Enabling Data Statistics will automatically disable Network Acceleration to ensure stable performance.
- Data Statistics only tracks traffic usage for devices listed on the Client page. If a device connects to the router via a tunnel interface (e.g., VPN Client, Tailscale, or AstroWarp), traffic originating from that device and forwarded through the router is excluded from these statistics.
Supported Models
Supported Models
- GL-MT6000 (Fortify)
- GL-BE14000 (Flint 4)
- GL-BE10000 (Slate 7 Pro)
- GL-E5800 (Mudi 7)
- GL-MT5000 (Brume 3)
- GL-MT3600BE (Beryl 7)
- GL-BE6500 (Flint 3e)
- GL-BE9300 (Flint 3)
- GL-BE3600 (Slate 7)
- GL-MT6000 (Flint 2)
- GL-MT3000 (Beryl AX)
Unsupported Models
- GL-MG1300 (Mango 2)
- GL-X2000 (Spitz Plus)
- GL-X3000 (Spitz AX)
- GL-XE3000 (Puli AX)
- GL-B3000 (Marble)
- GL-AX1800 (Flint)
- GL-AXT1800 (Slate AX)
- GL-SFT1200 (Opal)
- GL-MT1300 (Beryl)
- GL-E750/E750V2 (Mudi)
- GL-AR750S (Slate)
- GL-XE300 (Puli)
- GL-X750 (Spitz)
- GL-MT300N-V2 (Mango)
- GL-AR300M Series (Shadow)
- GL-B1300 (Convexa-B)
- GL-X300B (Collie)
- GL-A1300 (Slate Plus)
- GL-MT2500/GL-MT2500A (Brume 2)
- GL-AP1300 (Cirrus)
- GL-S1300 (Convexa-S)
For firmware v4.11 and above
Toggle the switch in the upper right corner to view the Application Total Data.
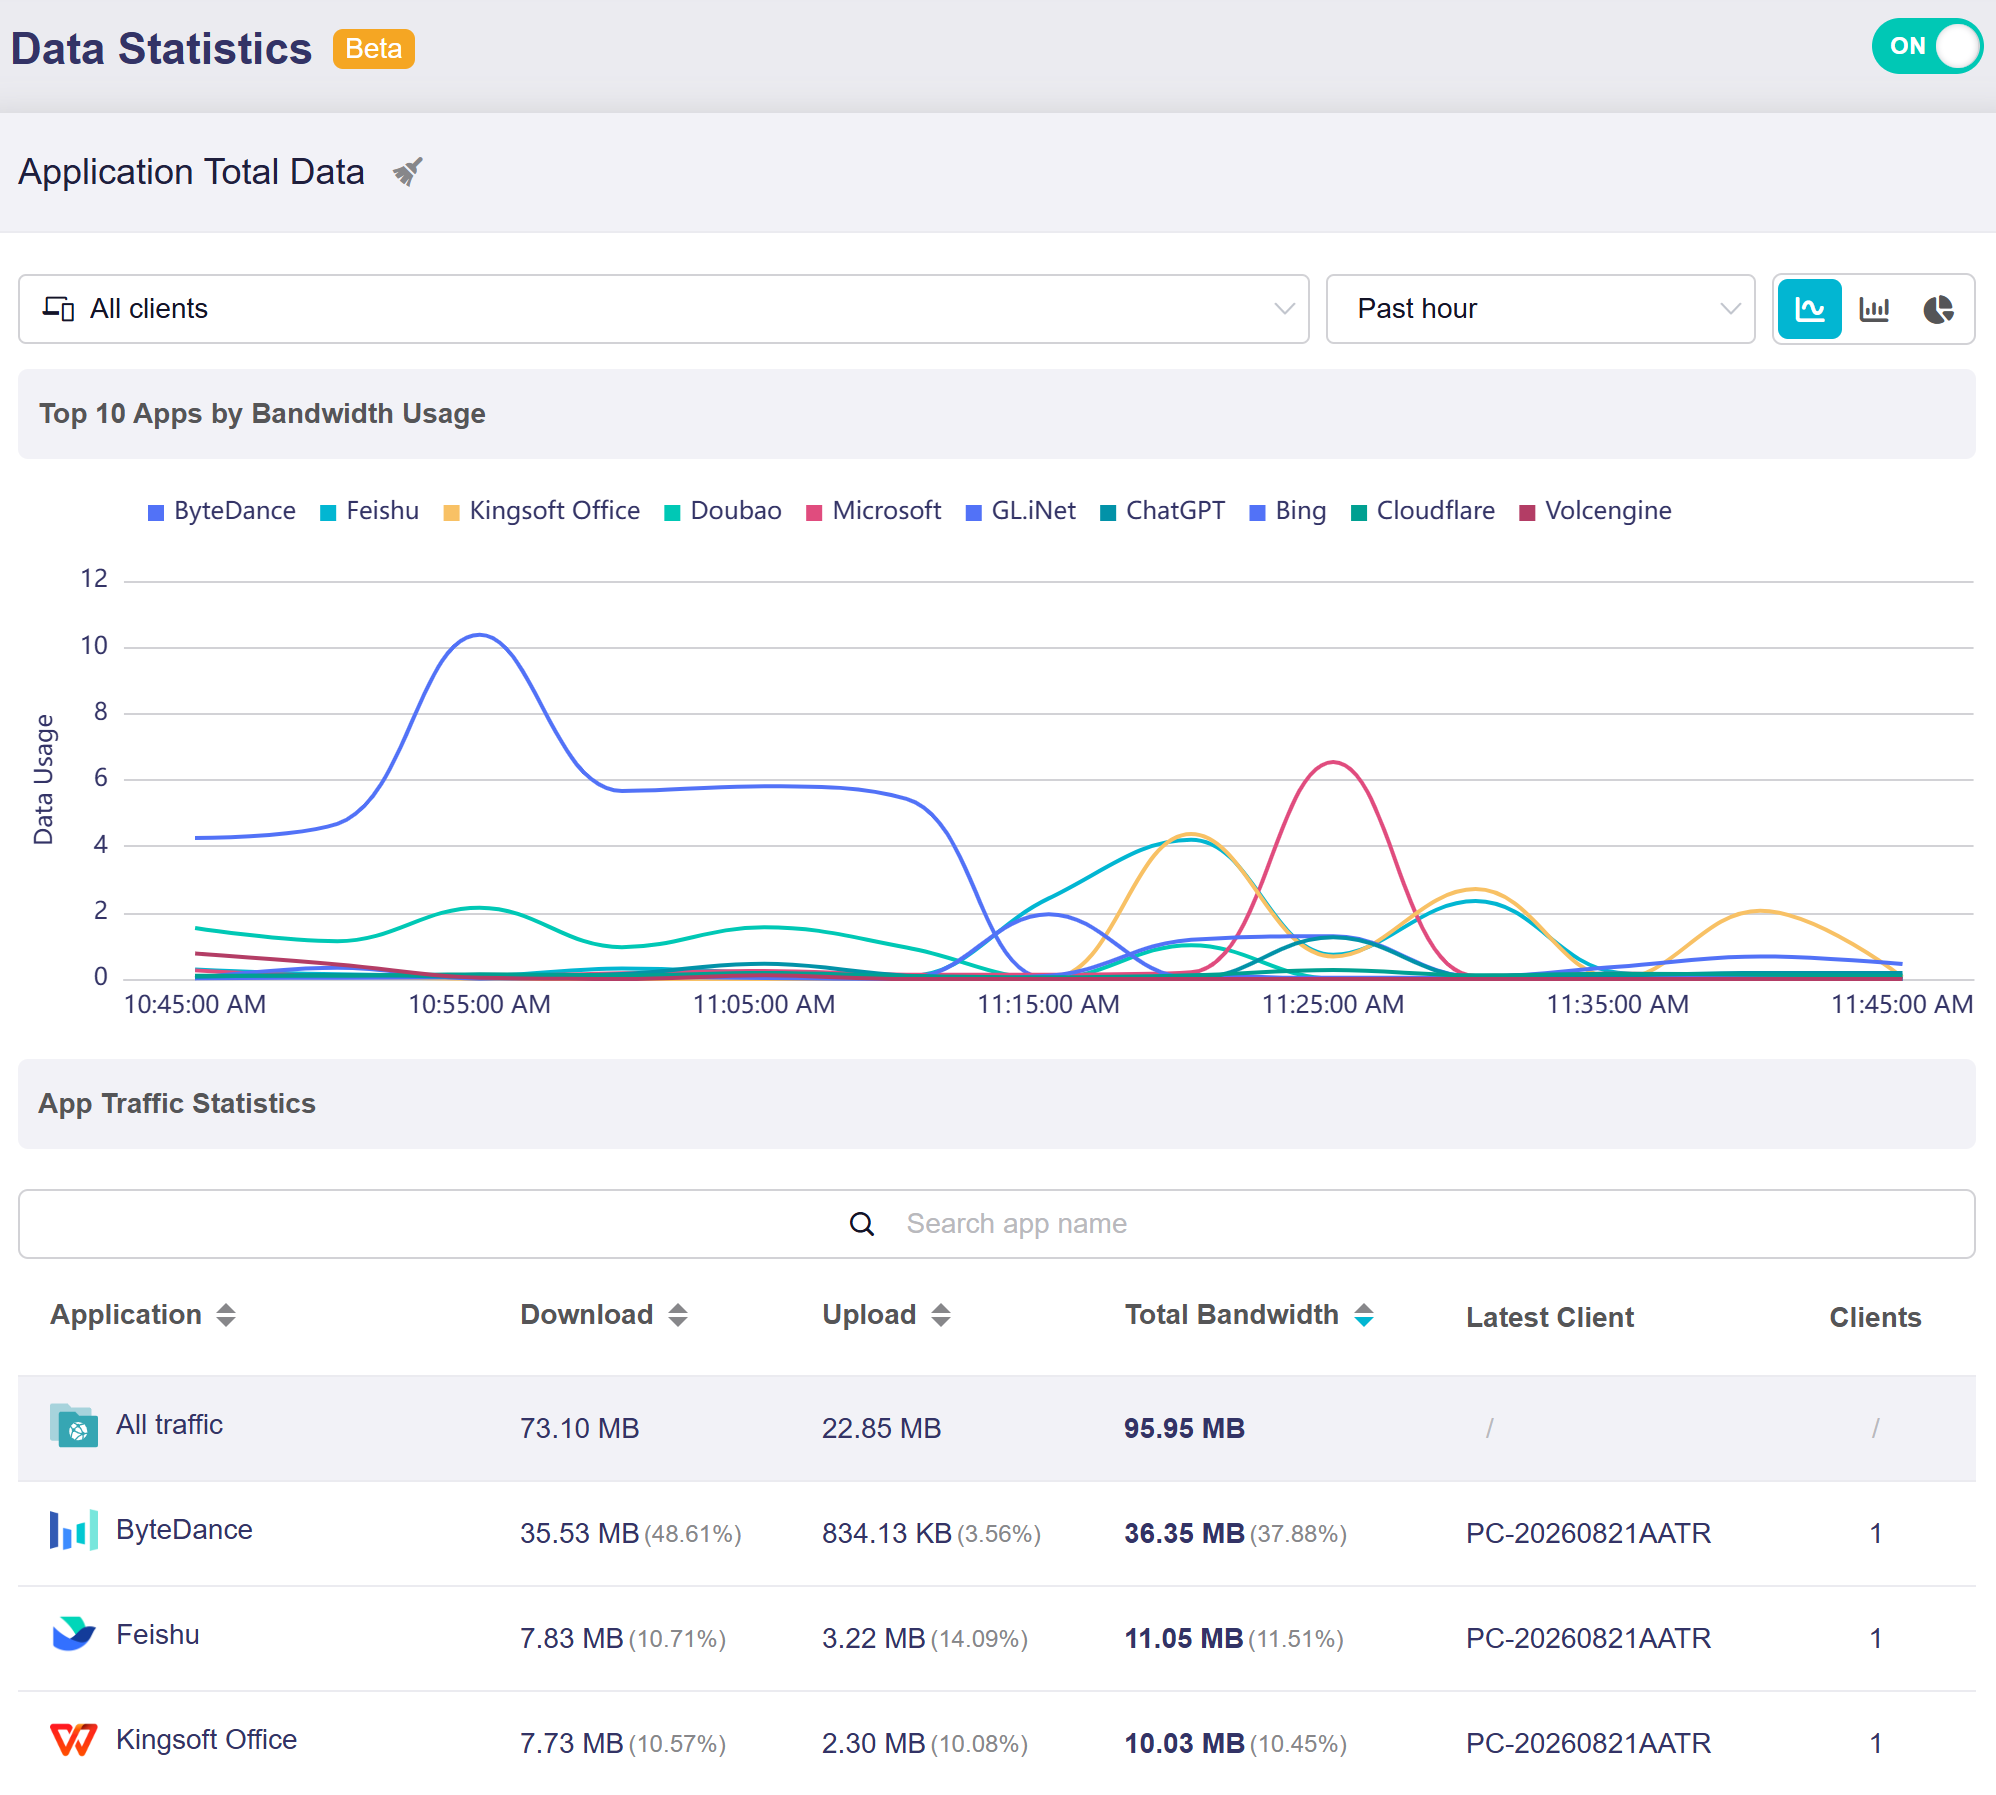
This page consists of two parts:
-
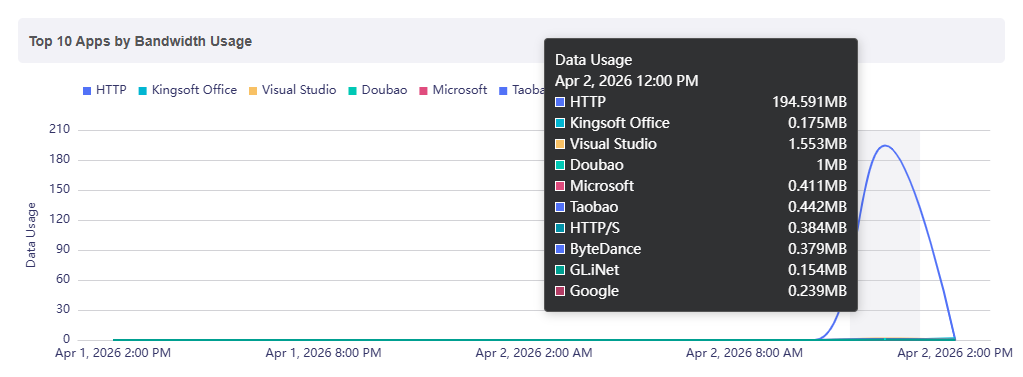
Top 10 Apps by Bandwidth Usage: It presents a time-based trend chart (e.g., for the past day) to show the bandwidth consumption of the top 10 applications over the selected period.
Hover your mouse over the chart to view data usage of the top 10 bandwidth-consuming apps at a specific time.
-
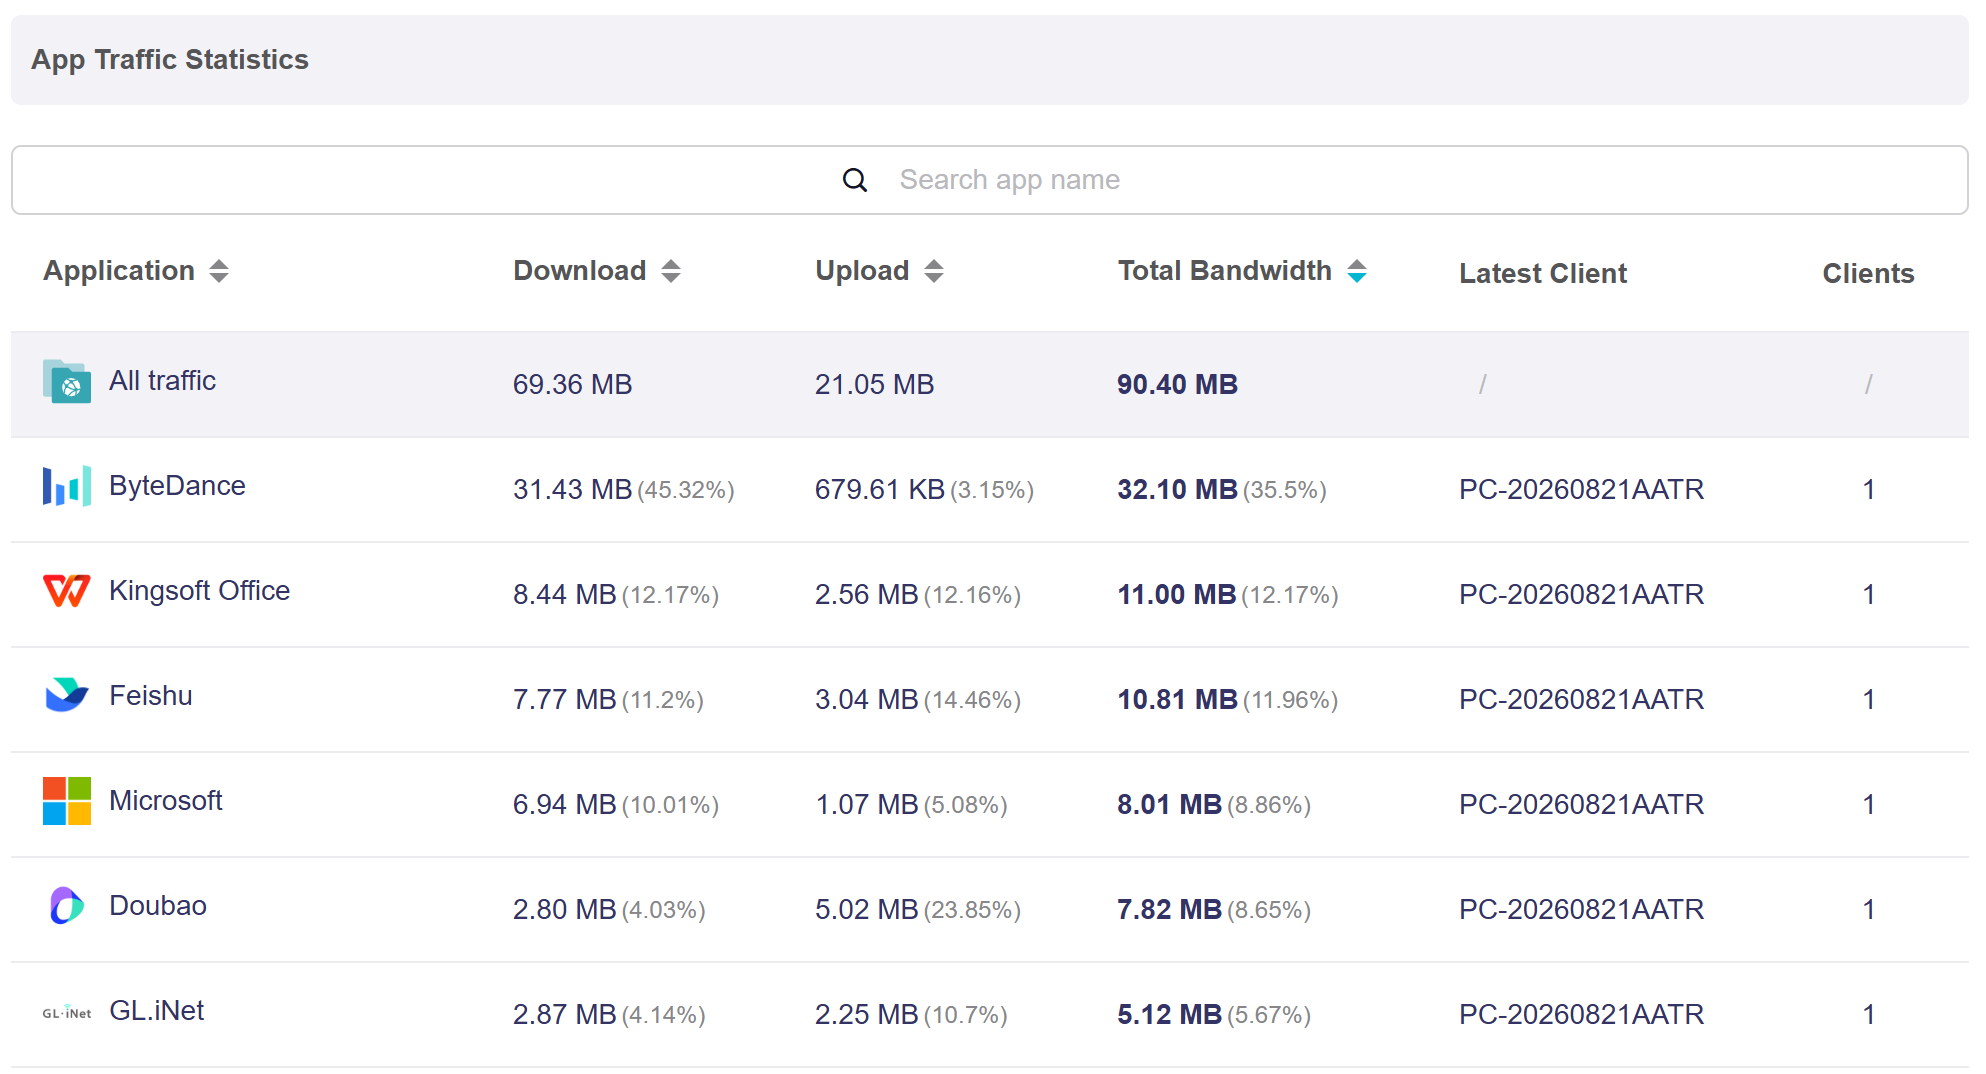
App Traffic Statistics: It displays detailed traffic metrics for each application, including Download, Upload, and Total Bandwidth. Search for specific apps in the search bar if required.
Click the sort arrow next to the column header to sort the list in ascending or descending order.
Data Storage Rules
-
Traffic statistics are saved to RAM every 15 seconds and stored in flash every 1 hour. Frequent flash writes are avoided to protect flash memory lifespan.
-
A soft reboot will not cause data loss. The system first writes data from RAM to flash before restarting.
-
A hard reboot (unplugging and replugging the power) or a firmware upgrade (retaining settings) may result in data loss of up to the most recent hour.
Client Selector
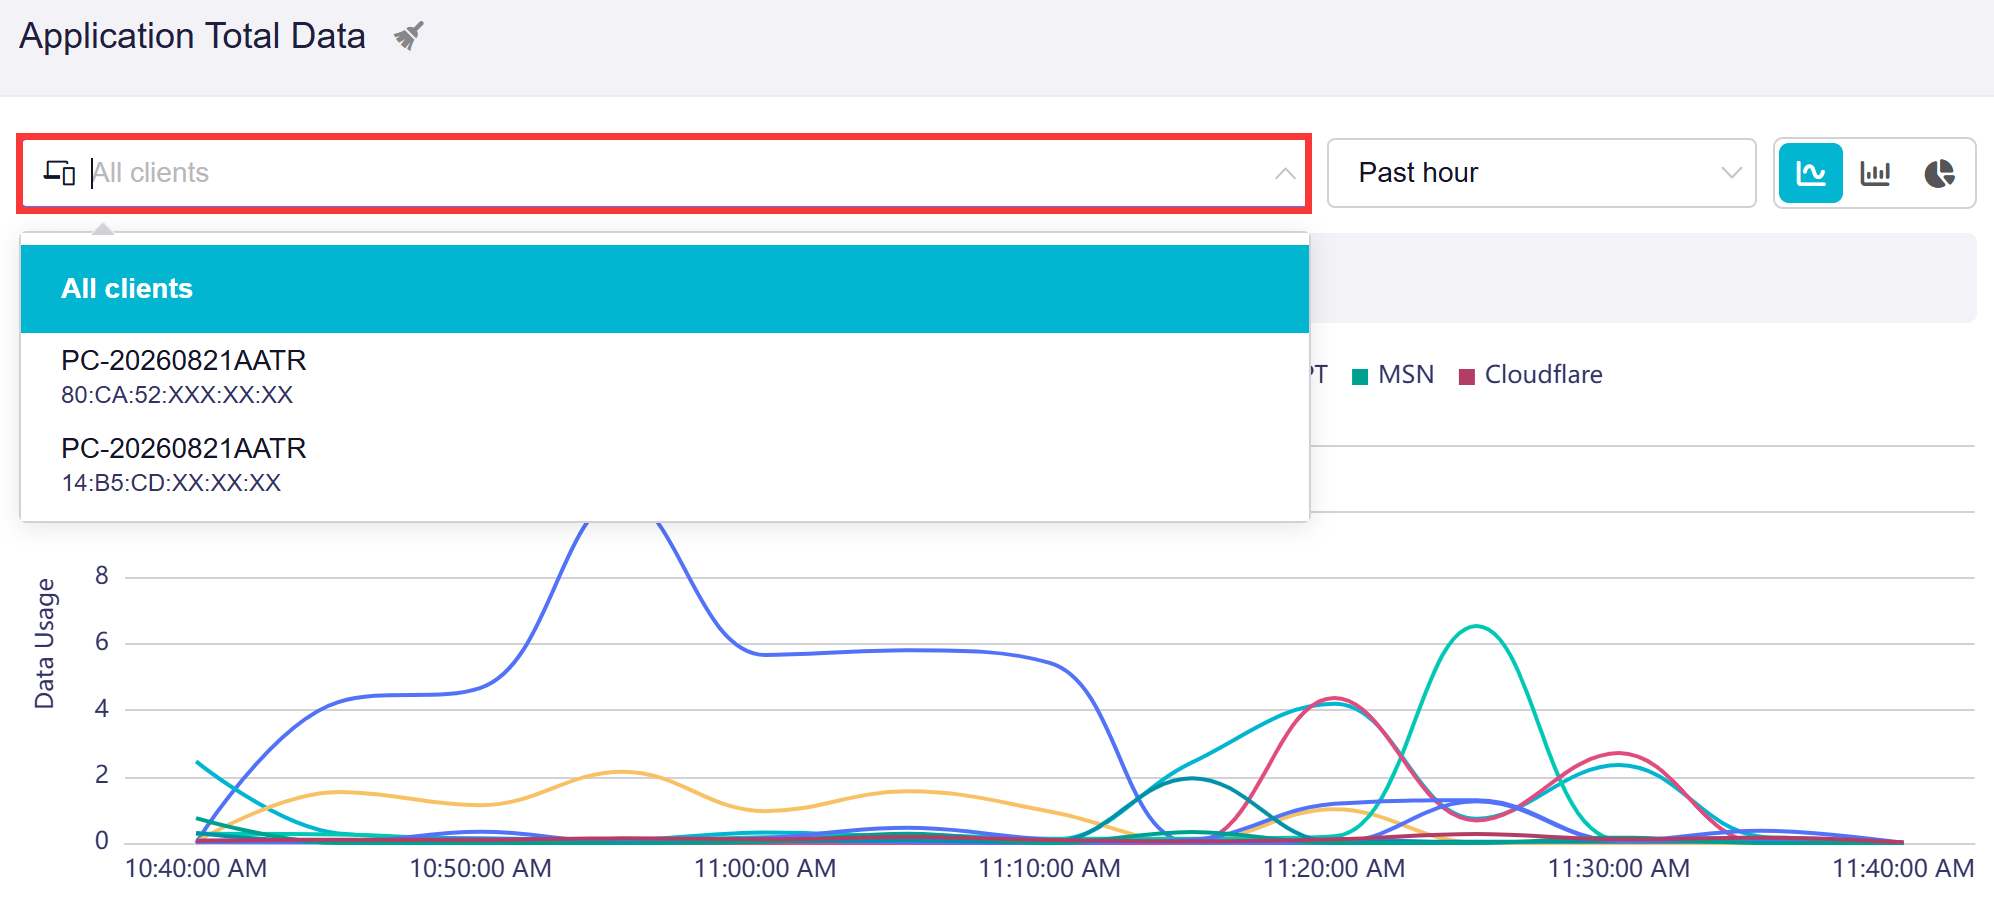
The Client Selector lets you select a specific client or keep the default All clients. The chart and statistics table will automatically refresh to display traffic data only for the selected device.
Note: This feature was introduced in firmware v4.11.
Switch Chart Views
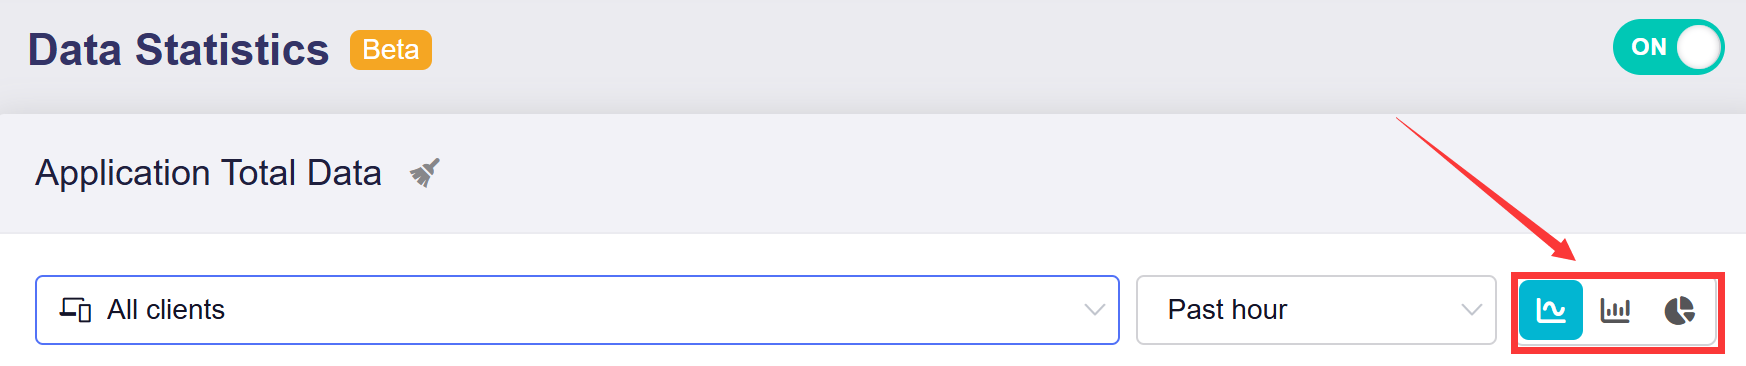
You can switch the chart type as needed when viewing the App Traffic Statistics.
Note: This feature was introduced in firmware v4.11.
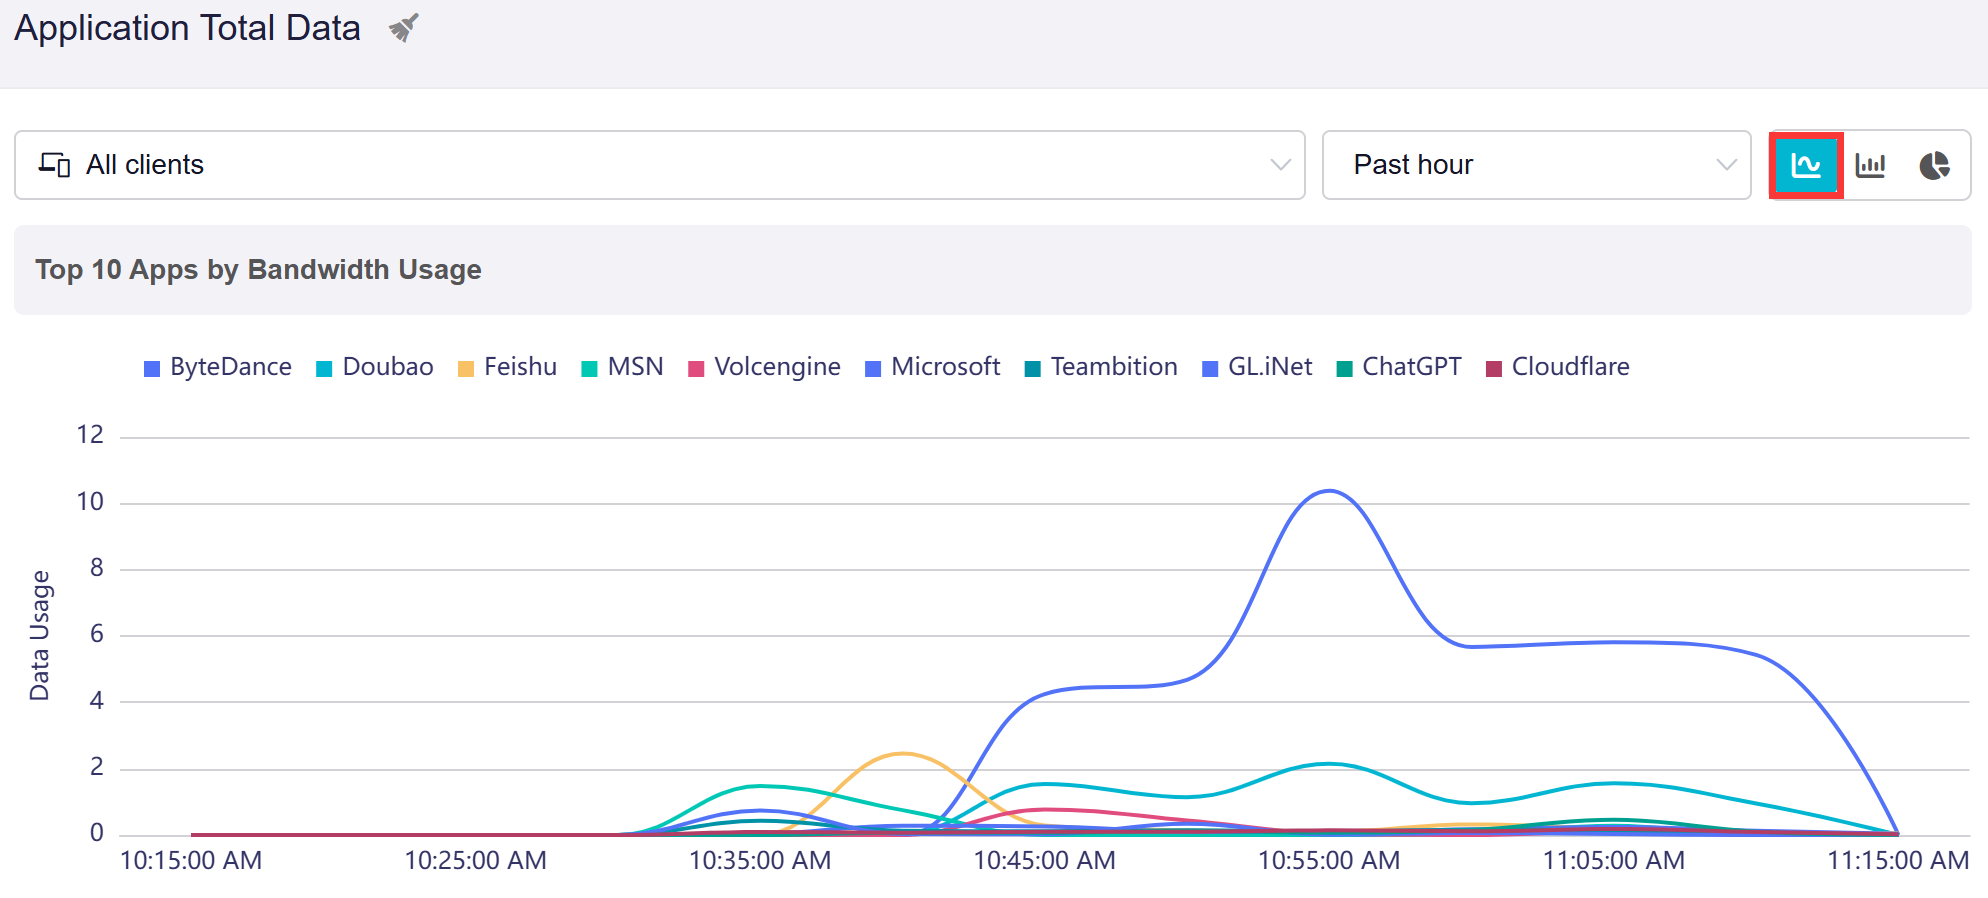
-
Line chart: The chart tracks bandwidth usage over the selected time range. Continuous curves reveal how traffic changes over time, making it ideal for spotting rising and falling usage trends.
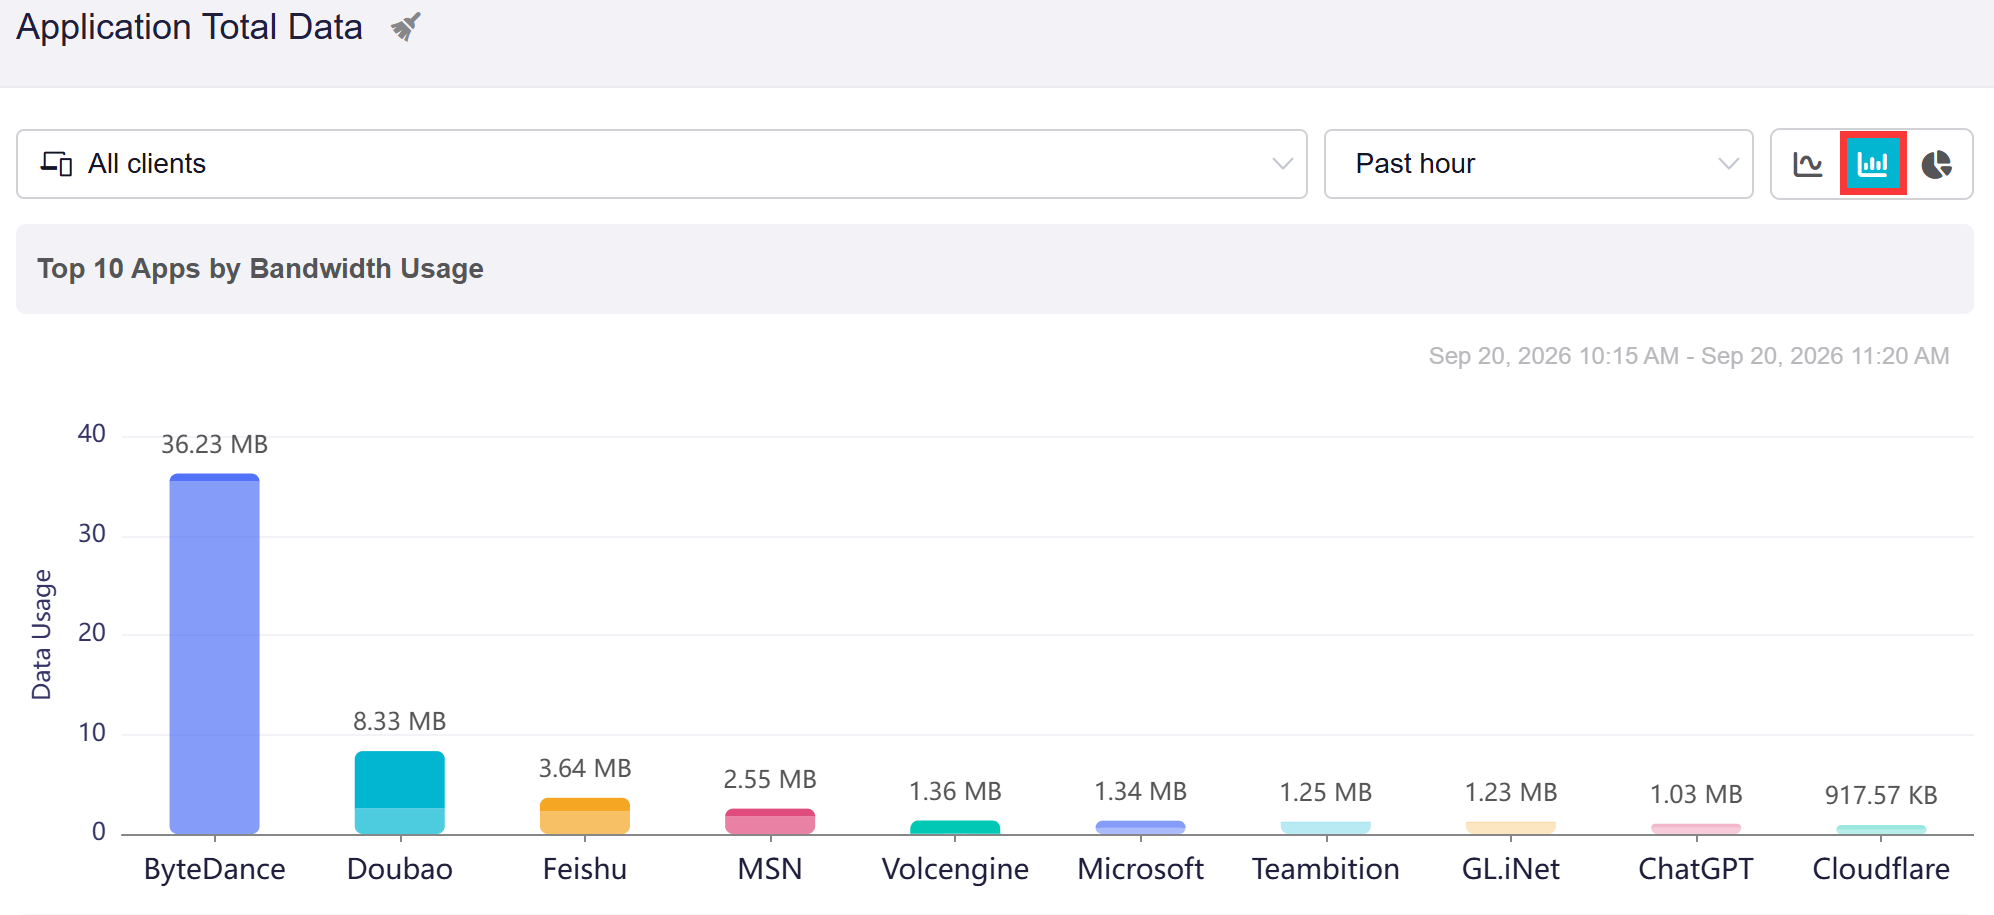
-
Bar chart: The chart compares bandwidth usage across applications side by side. Individual bars clearly show which apps consume more bandwidth at a glance.
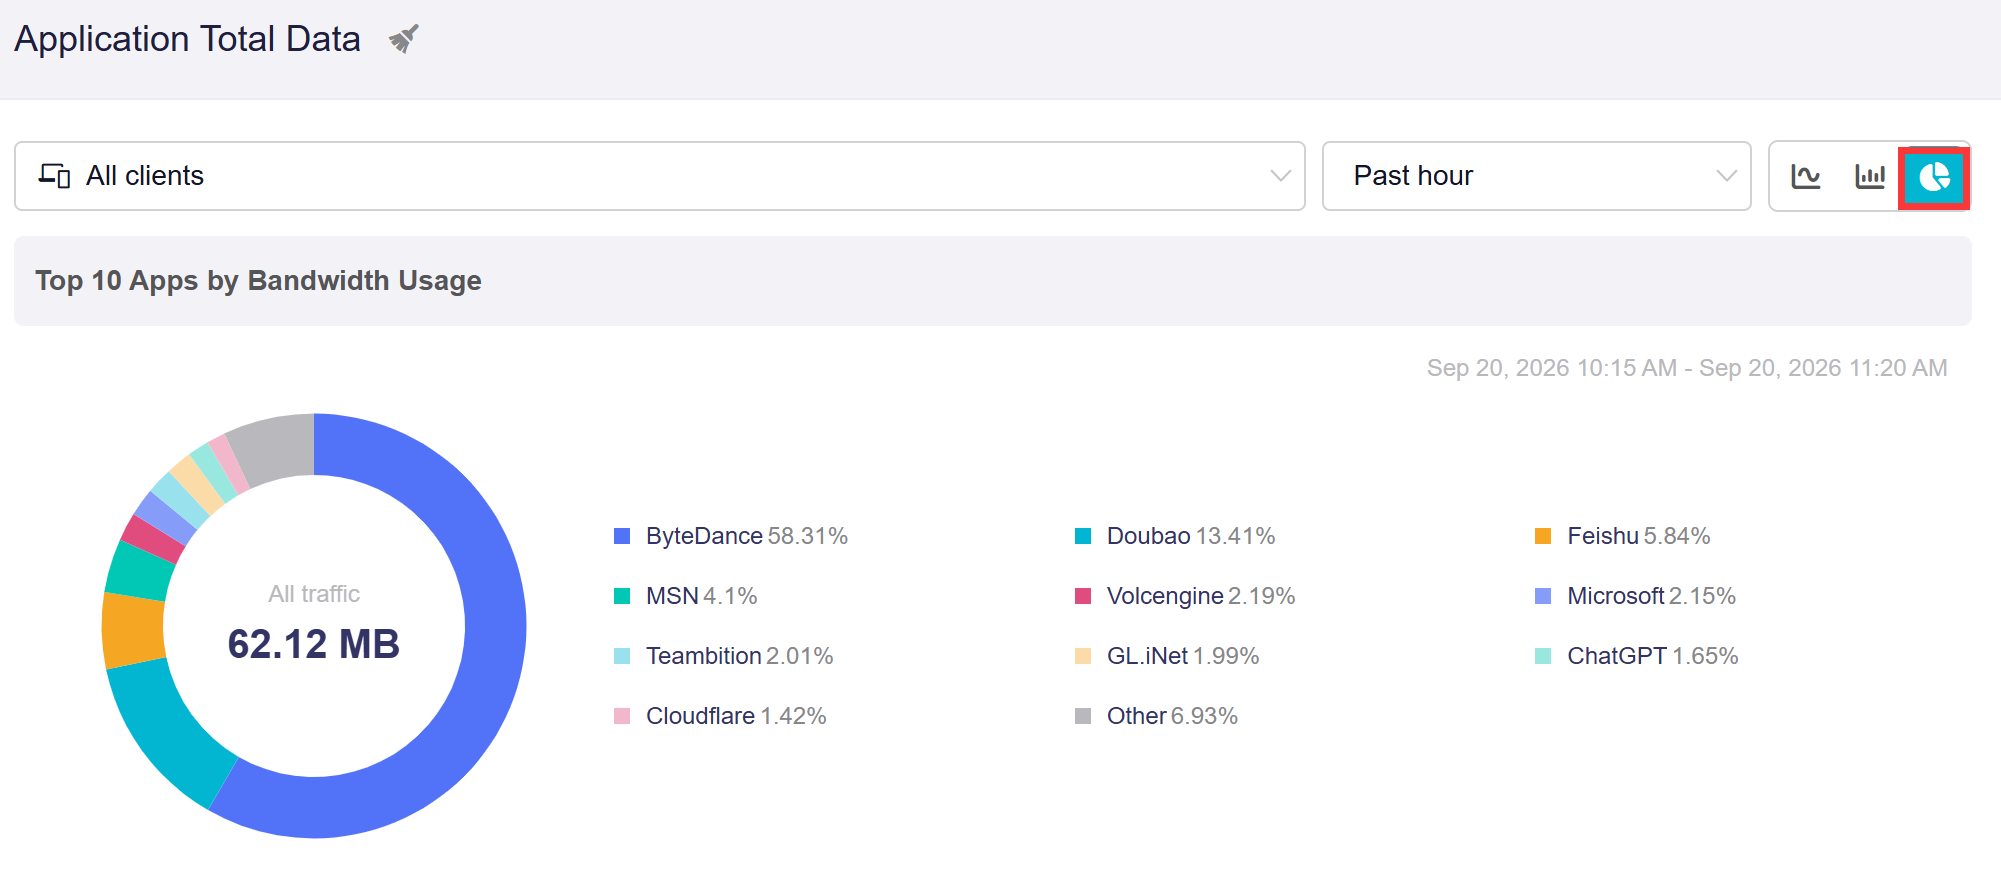
-
Pie chart: The chart breaks down total bandwidth usage into percentage shares. Slices visualize the relative proportion of traffic used by each application.
Switch Time Range
You can switch the time range between Past hour, Past day, and Past week as needed.
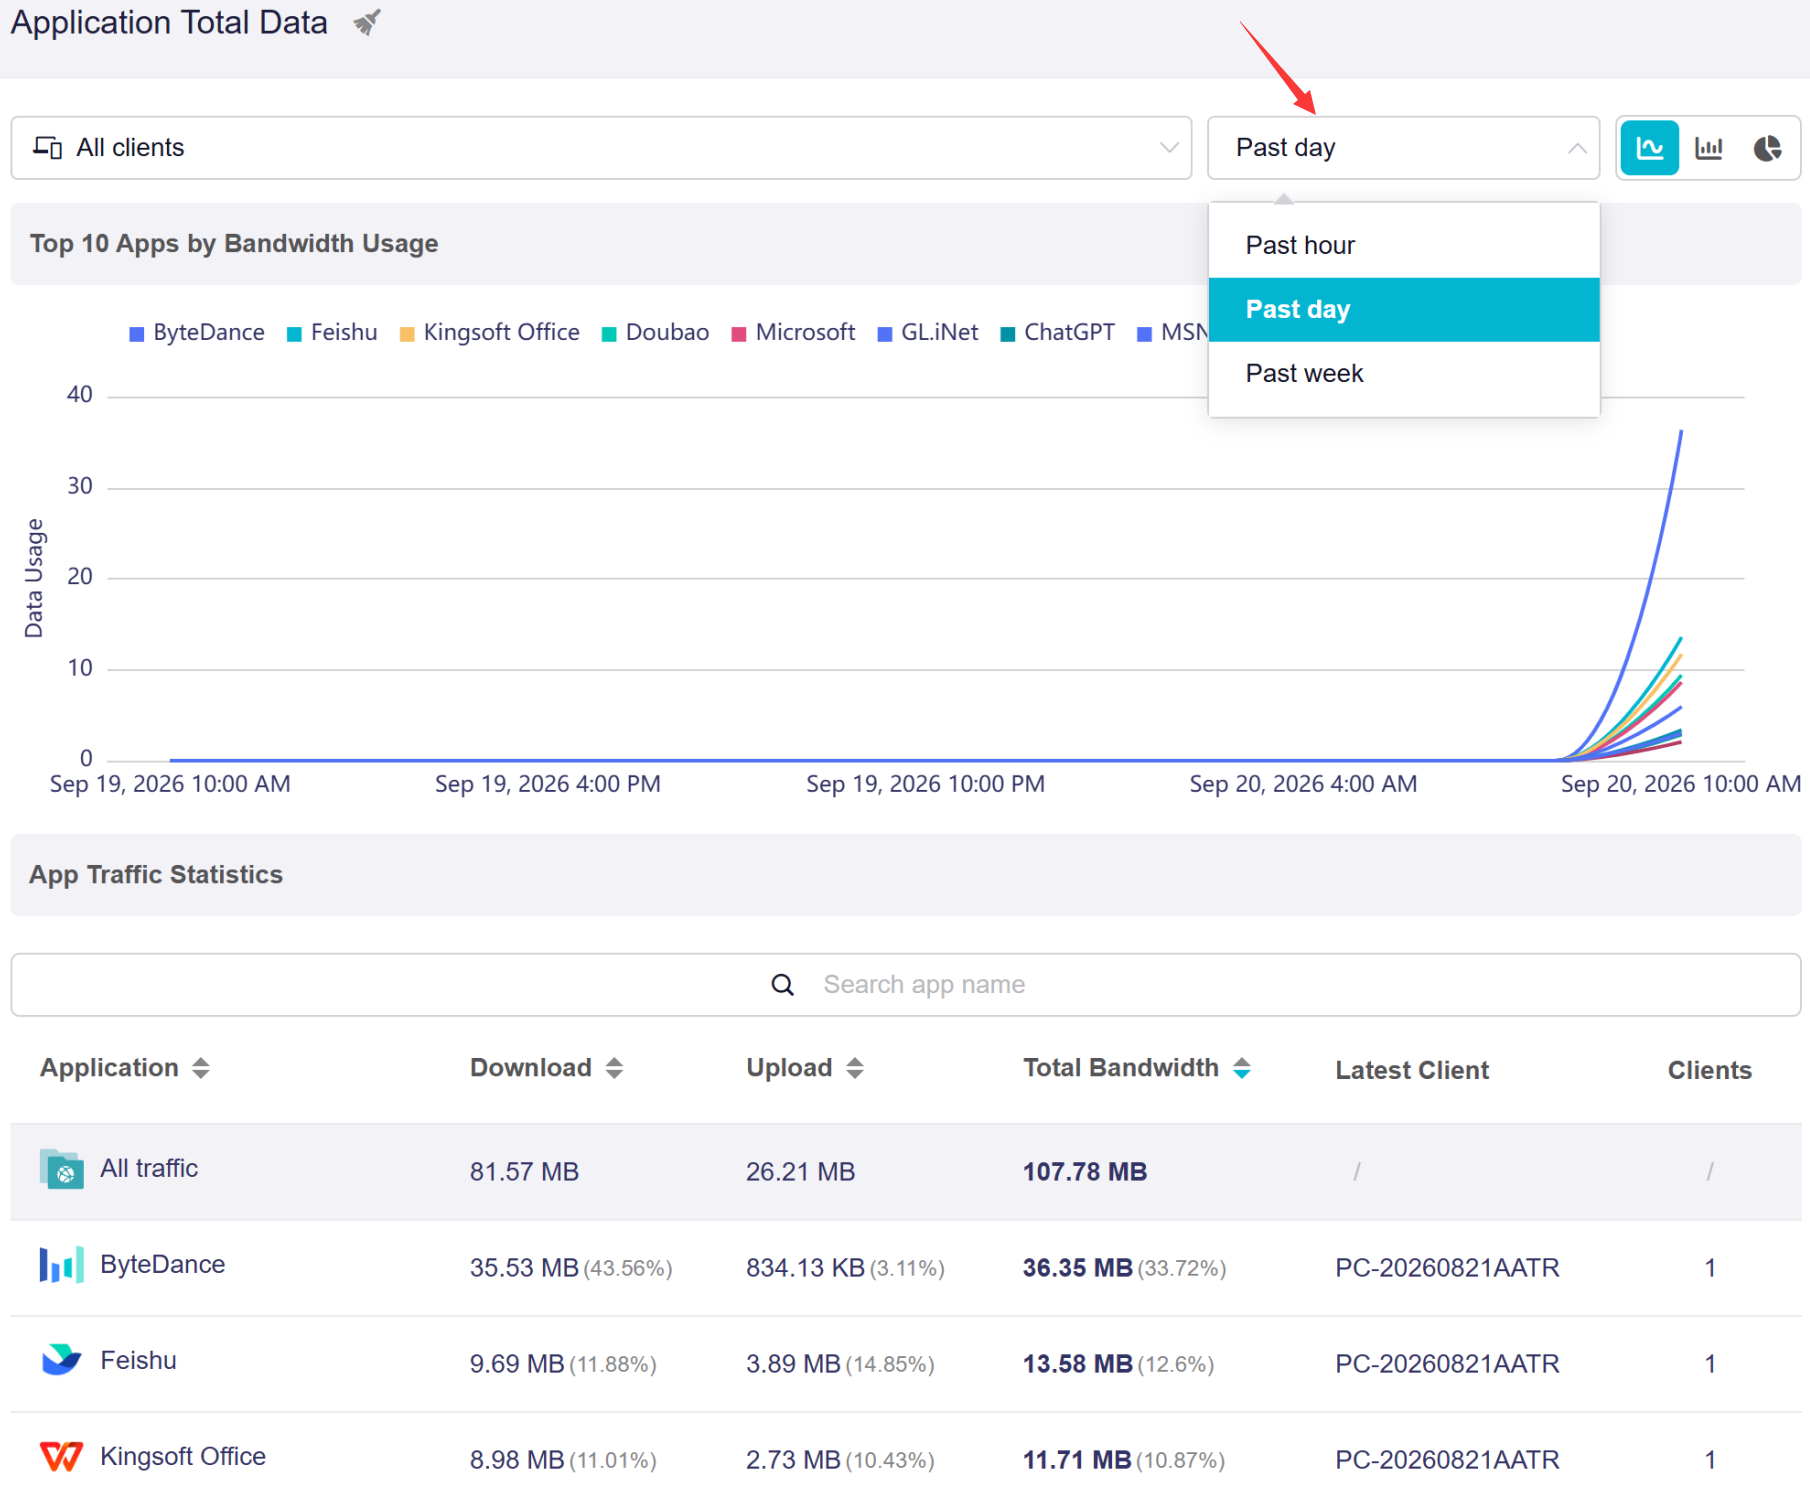
The time range you choose determines how the data is displayed:
-
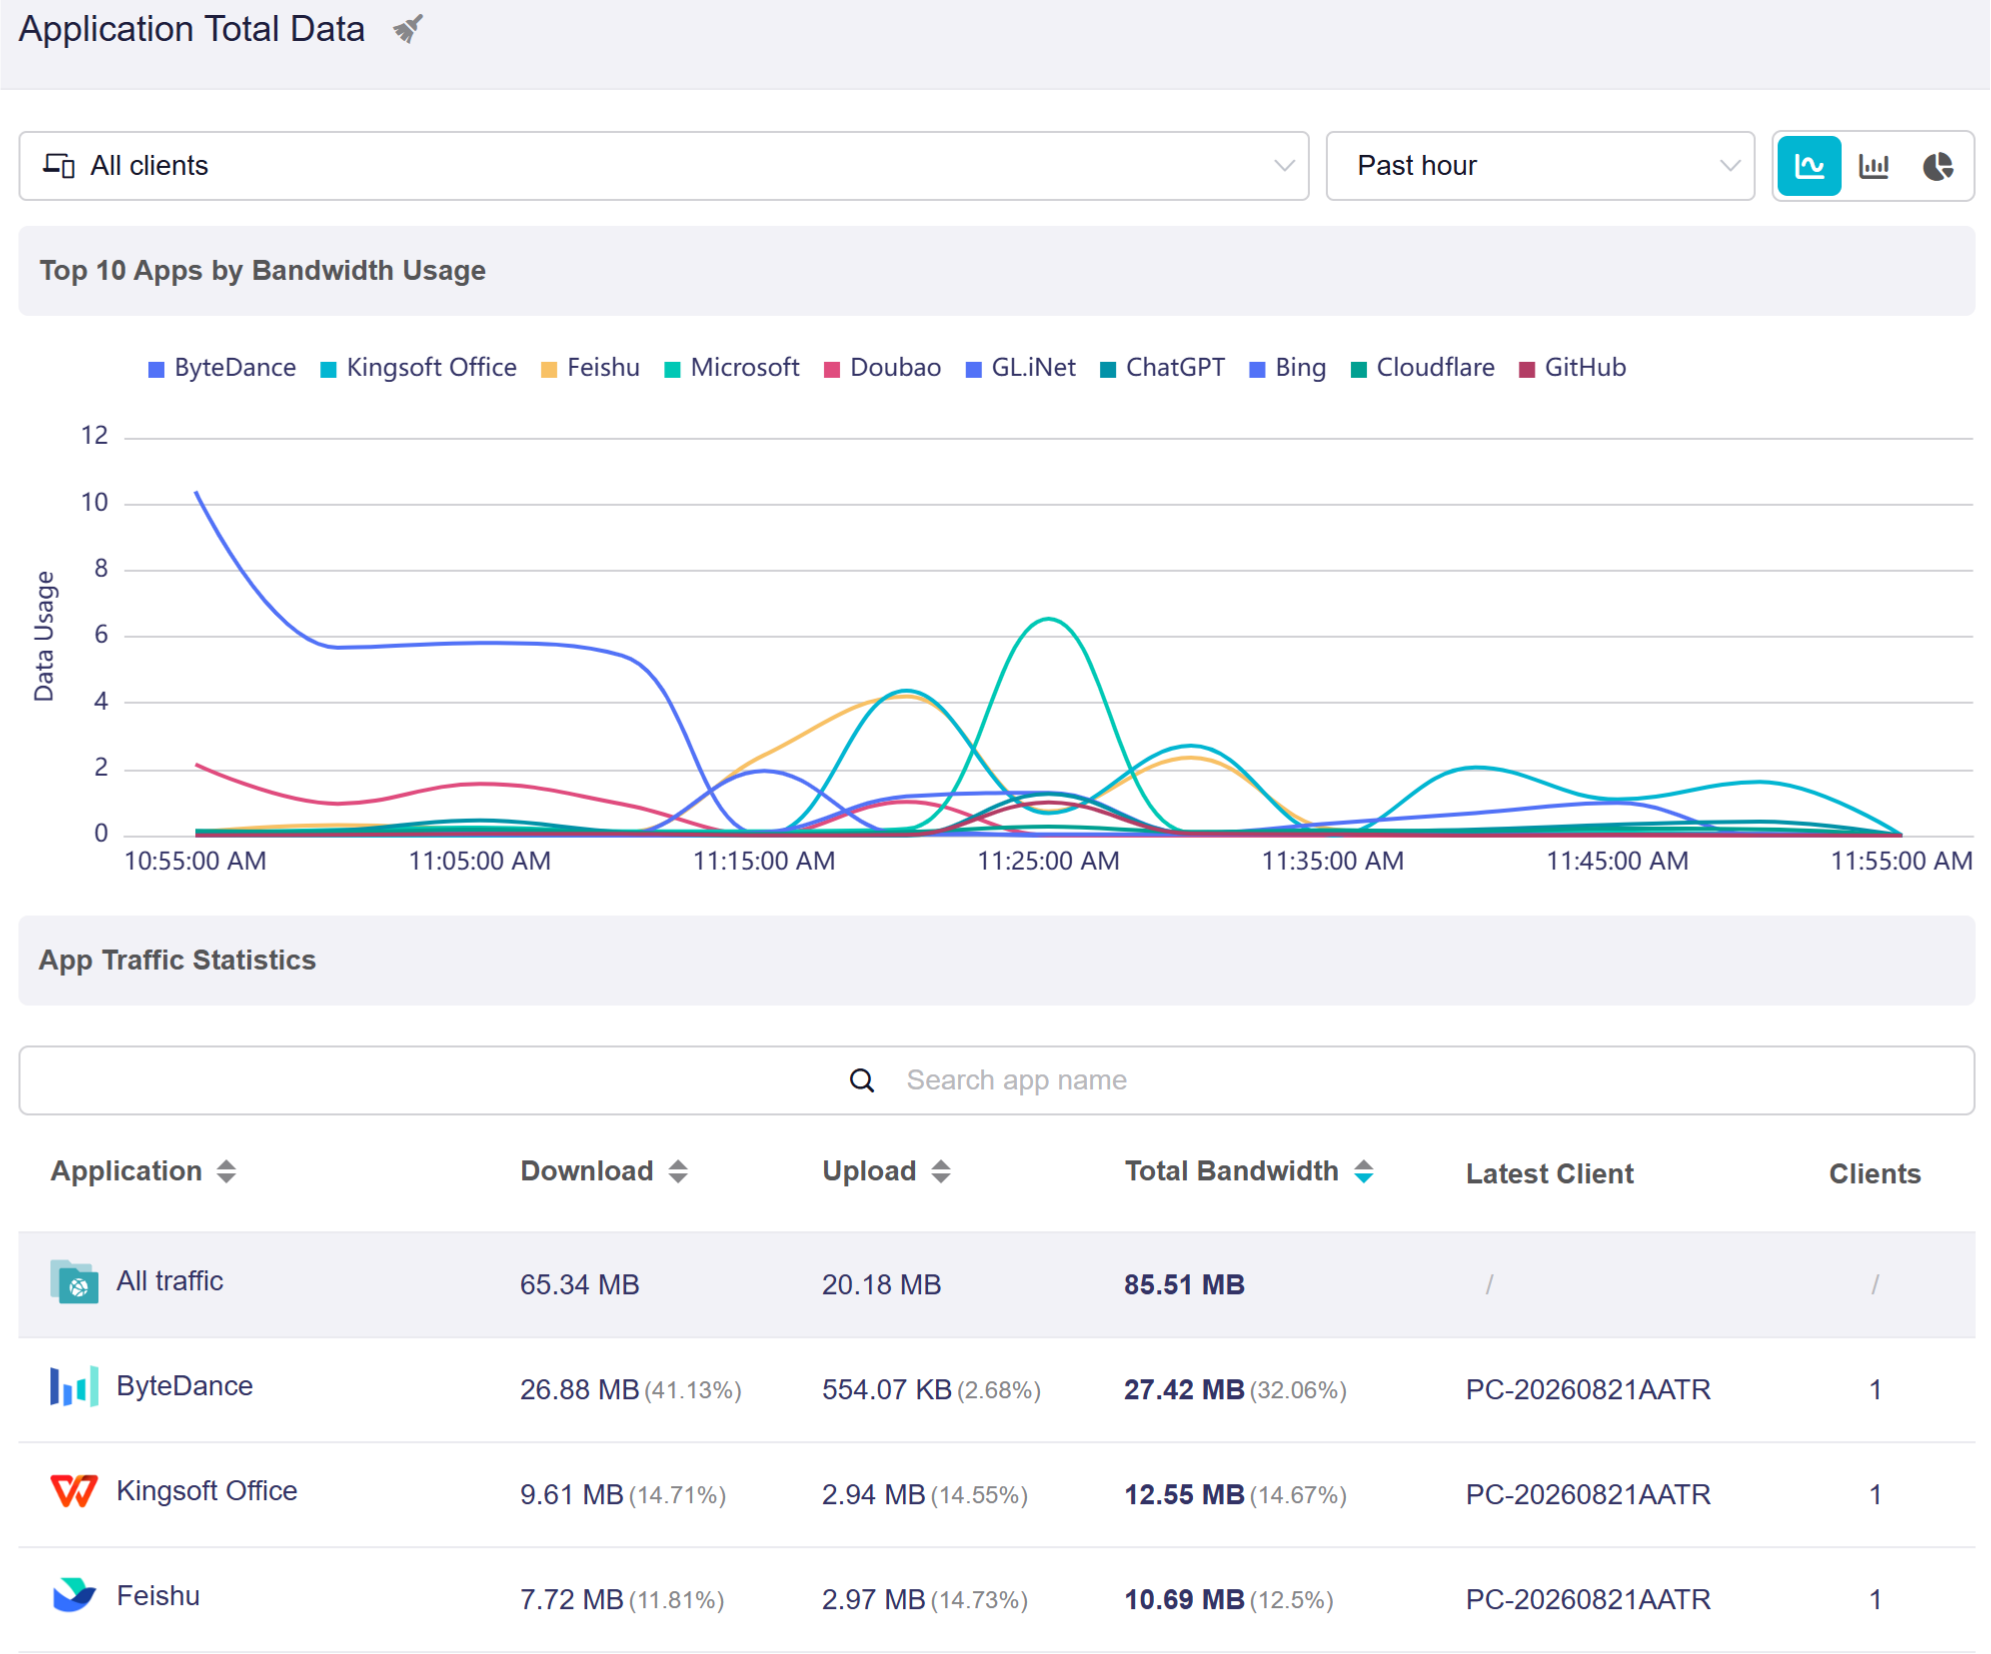
For a closer look (e.g., Past Hour): The chart shows fine-grained, real-time fluctuations. Peaks are taller and drops are steeper, making it easy to spot sudden spikes in bandwidth usage.
-
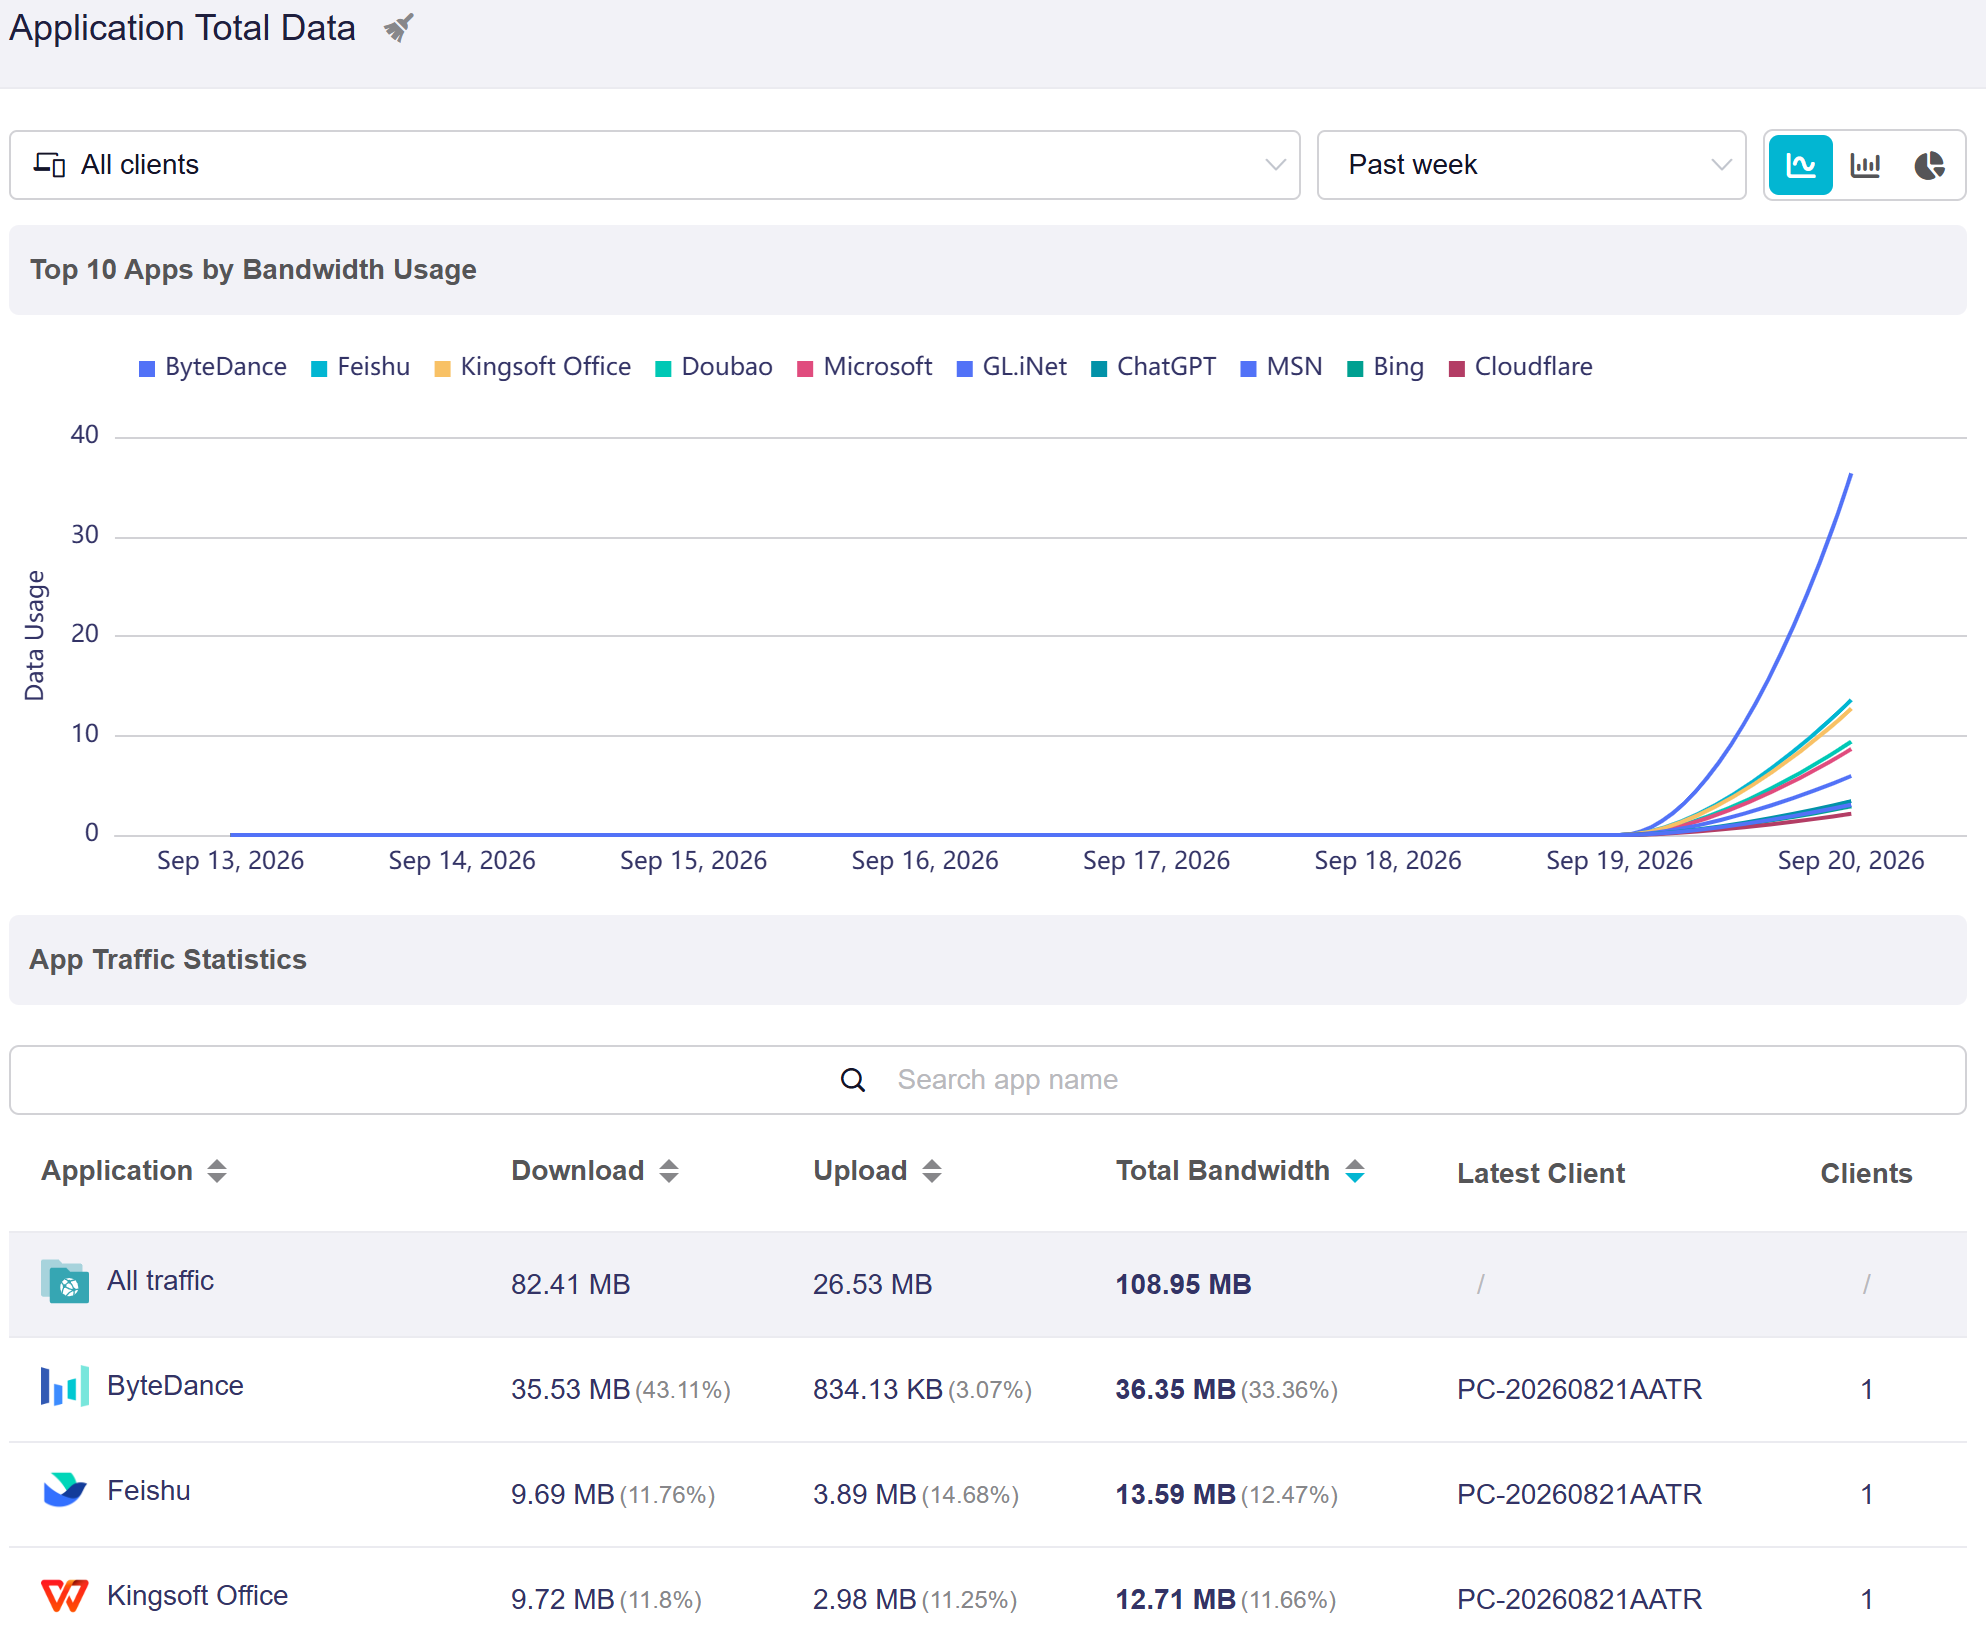
For a broad overview (e.g., Past Day or Past Week): The chart condenses the data into a longer timeline. The curves become smoother, showing the general traffic trend rather than every small change.
Clear Statistics
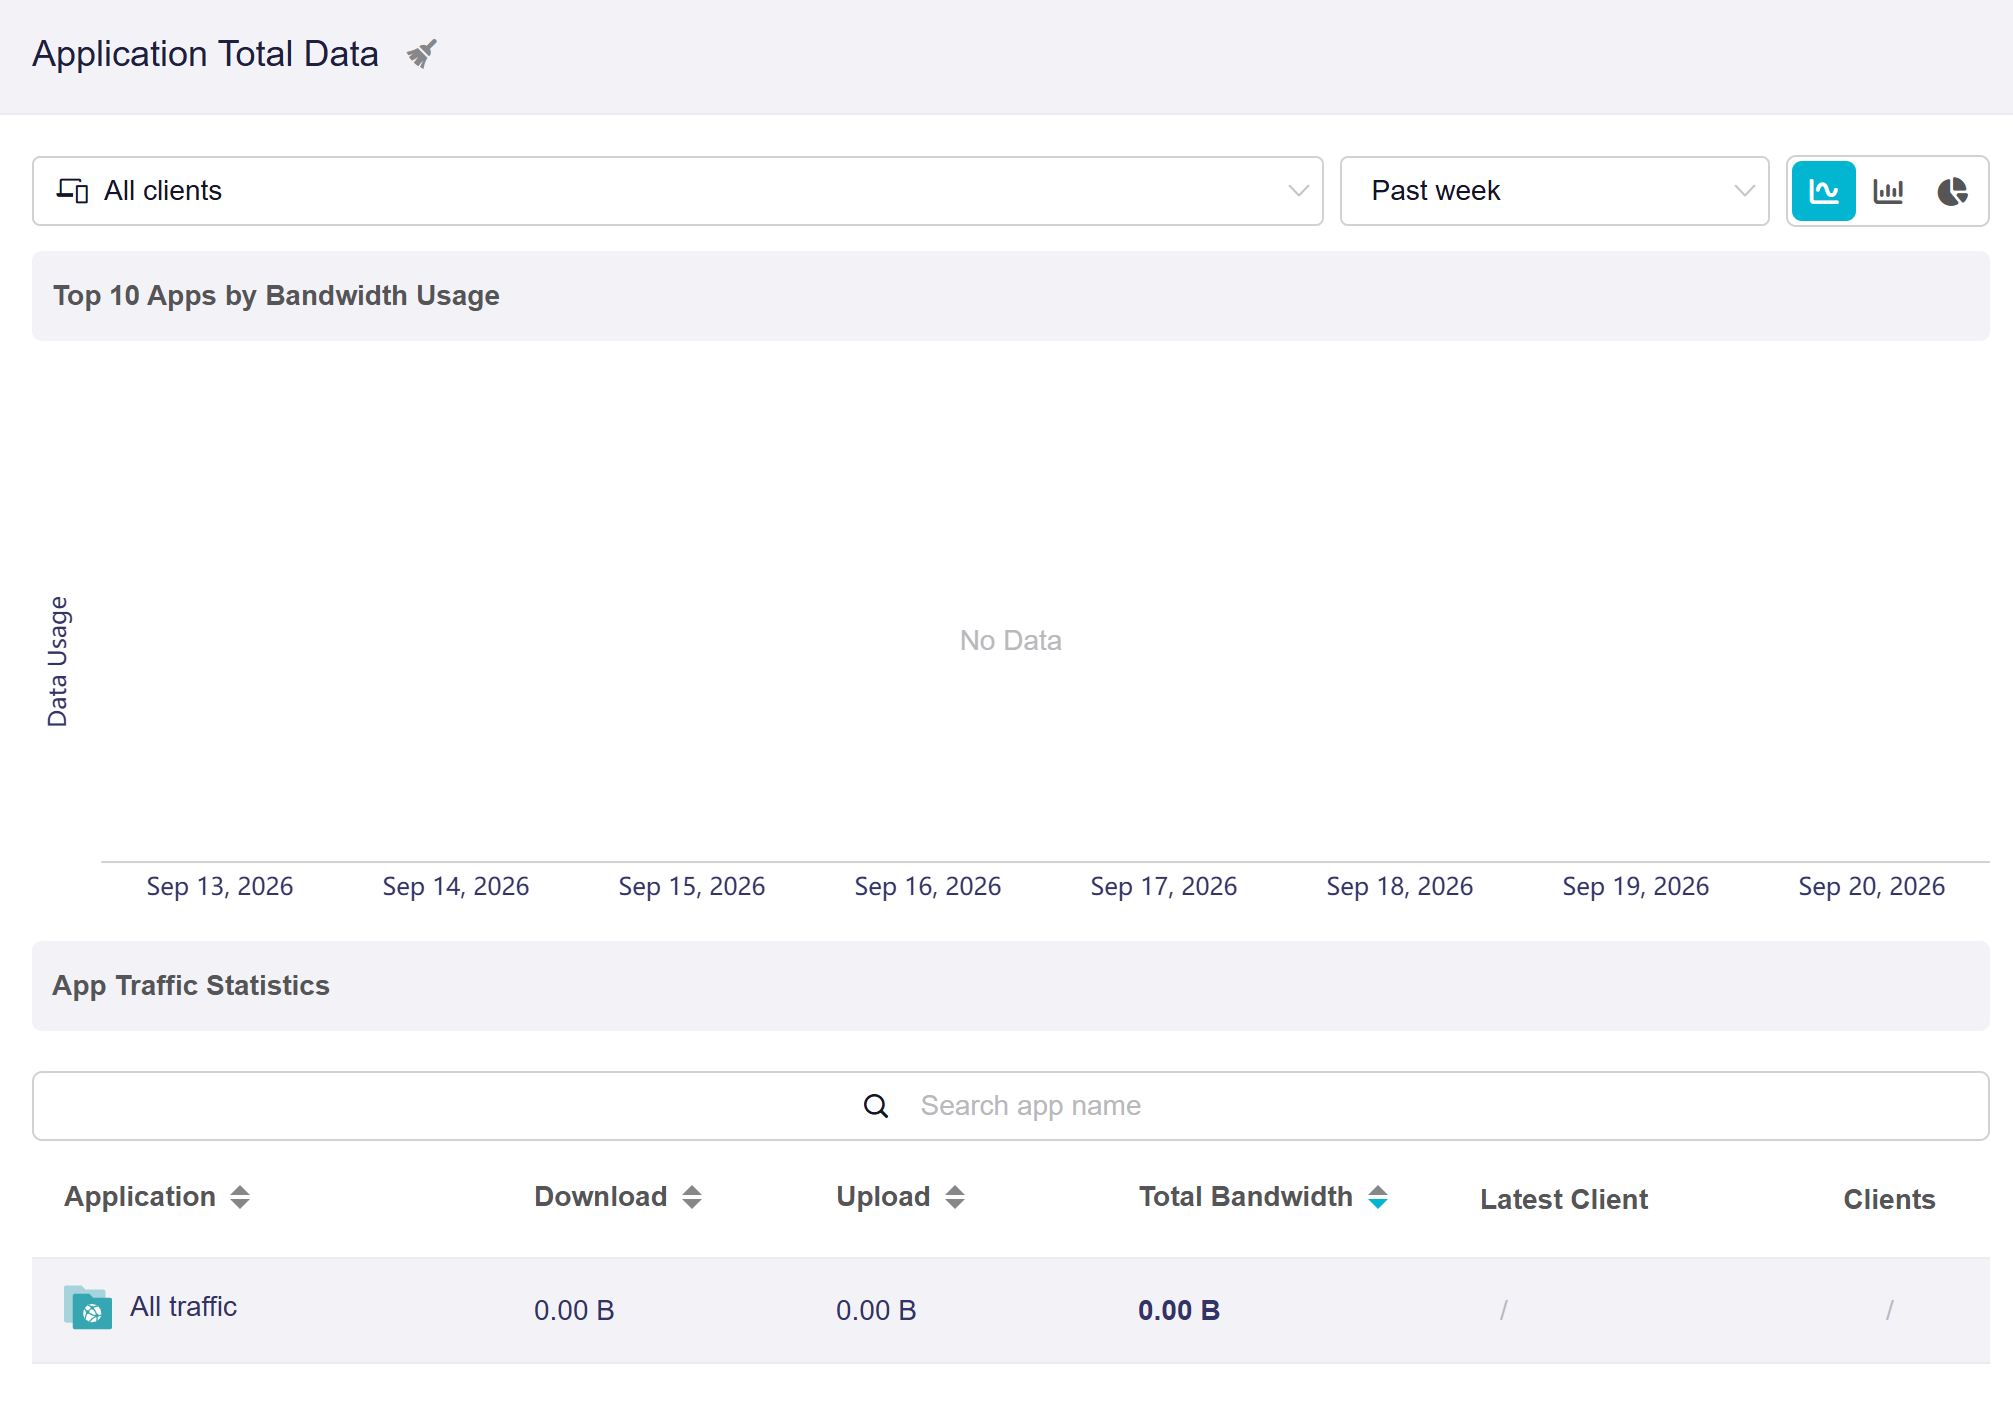
Click the broom icon in the upper left corner to clear statistics as needed.
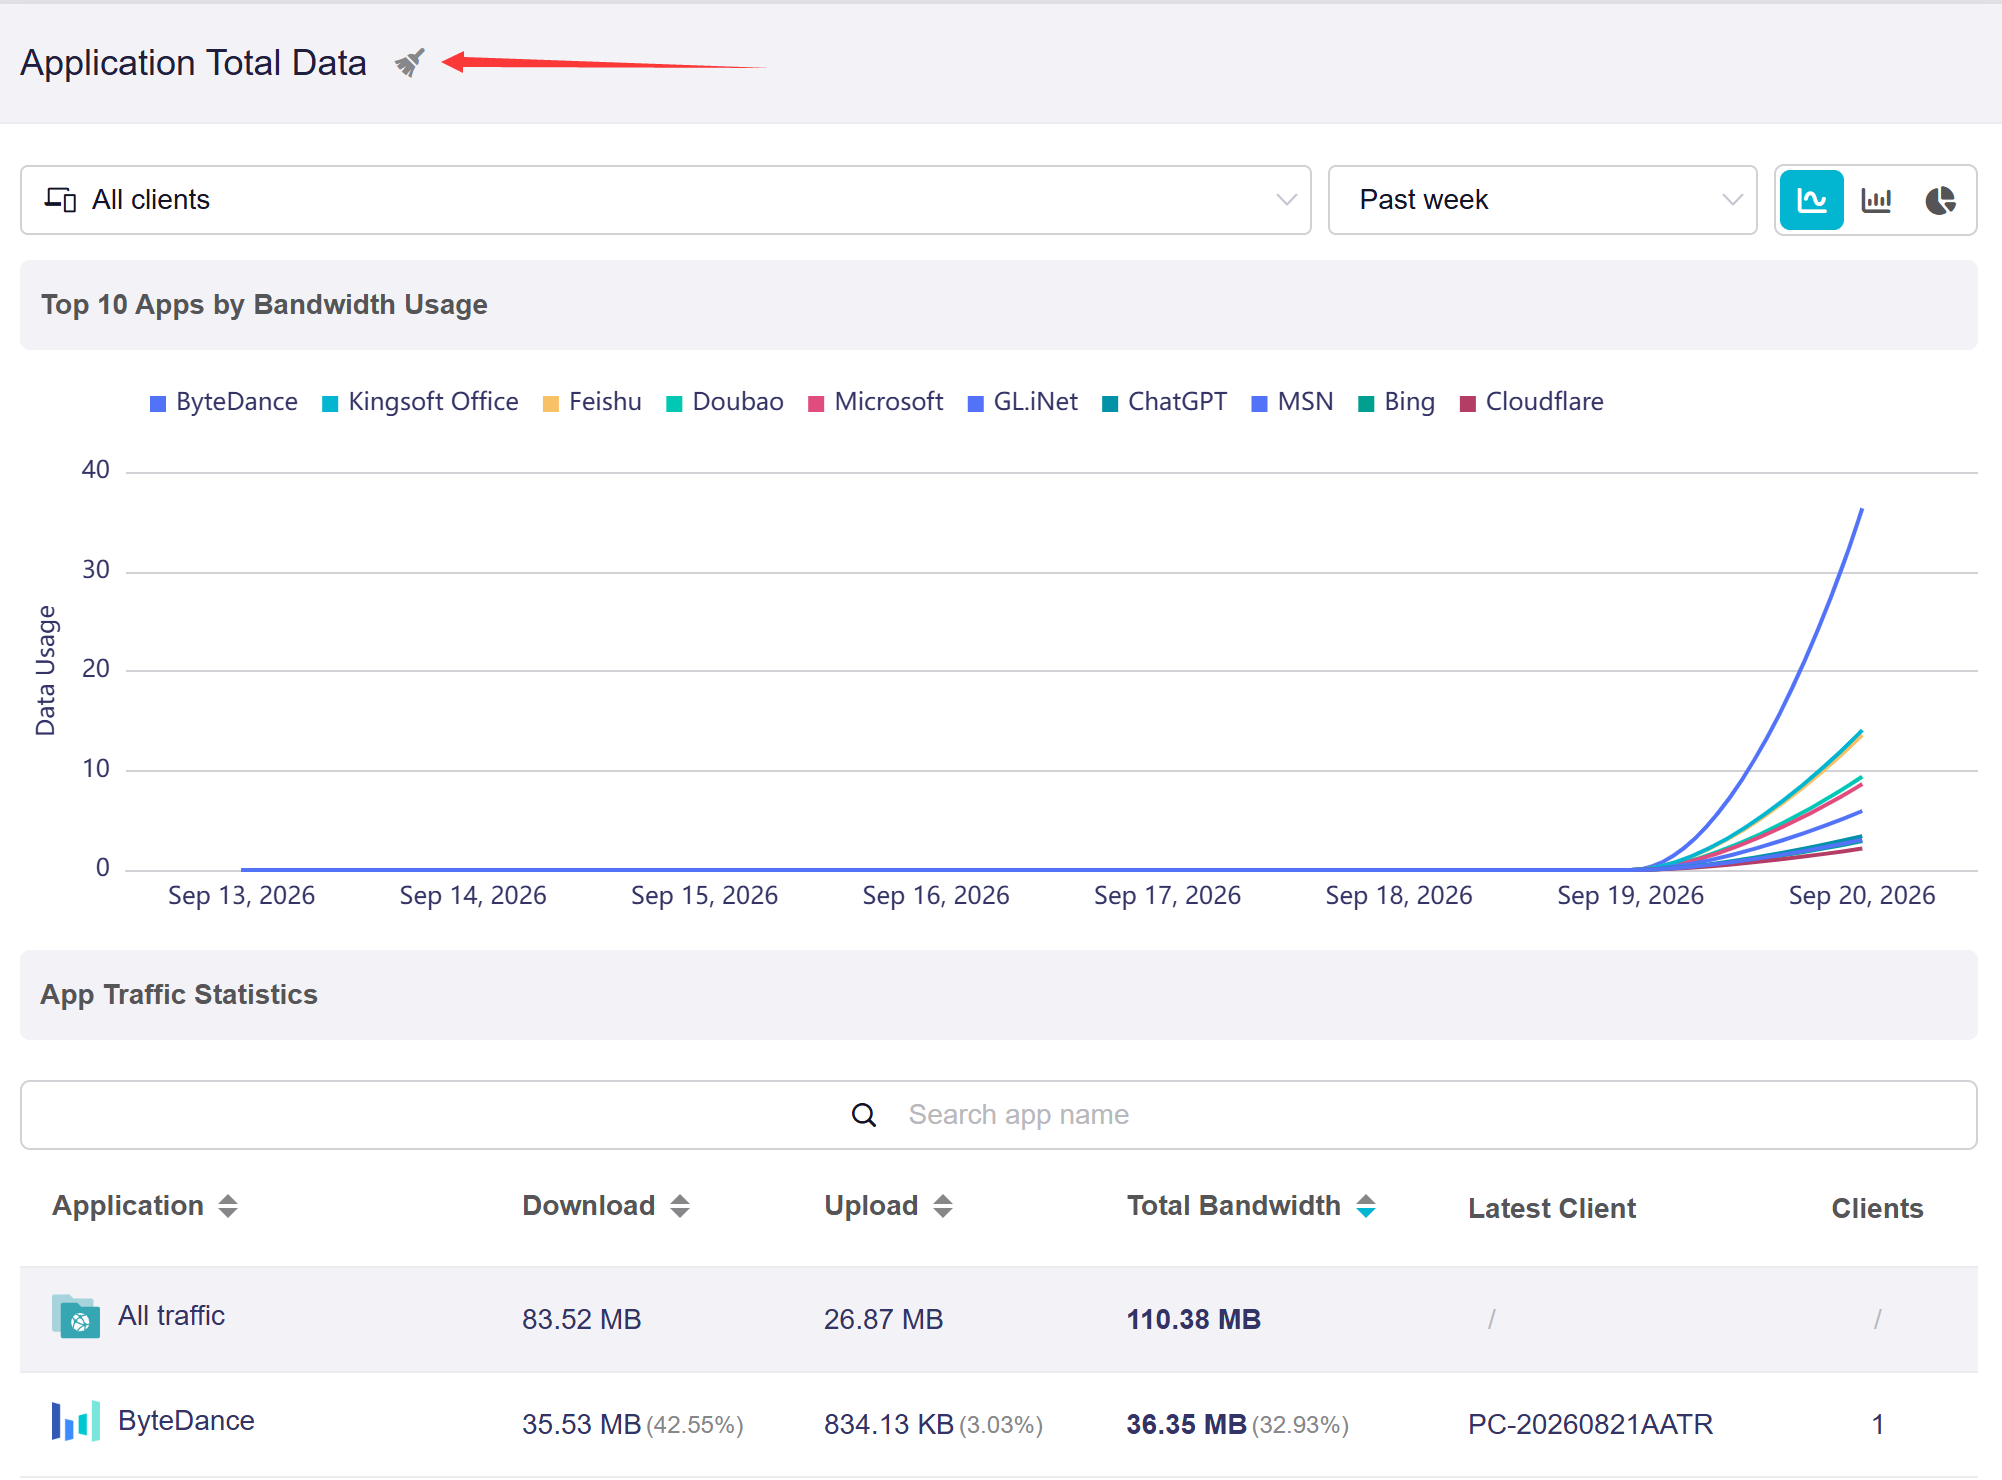
After clearing, the page will update as shown below. You may need to wait a moment for new statistics to start loading.
For firmware v4.9 to v4.10
Toggle the switch in the upper right corner to view the Application Total Data.
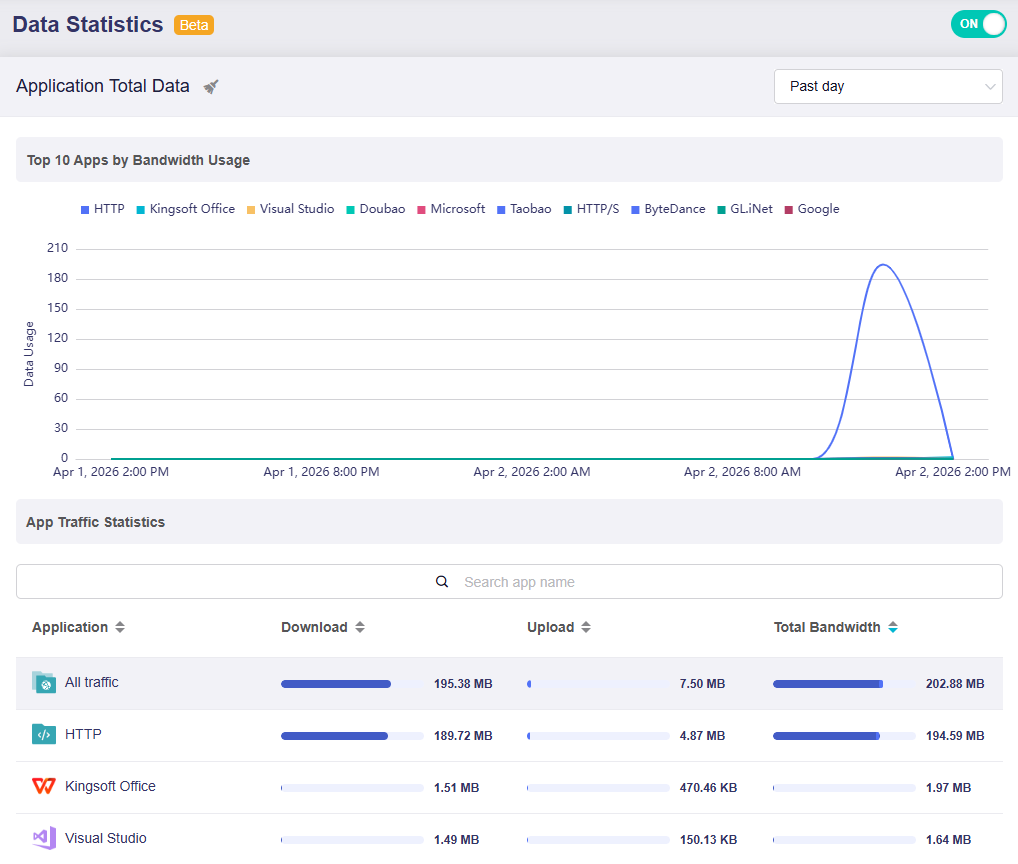
This page consists of two parts:
-
Top 10 Apps by Bandwidth Usage: It presents a time-based trend chart (e.g., for the past day) to show the bandwidth consumption of the top 10 applications over the selected period.
Hover your mouse over the chart to view data usage of the top 10 bandwidth-consuming apps at a specific time.
-
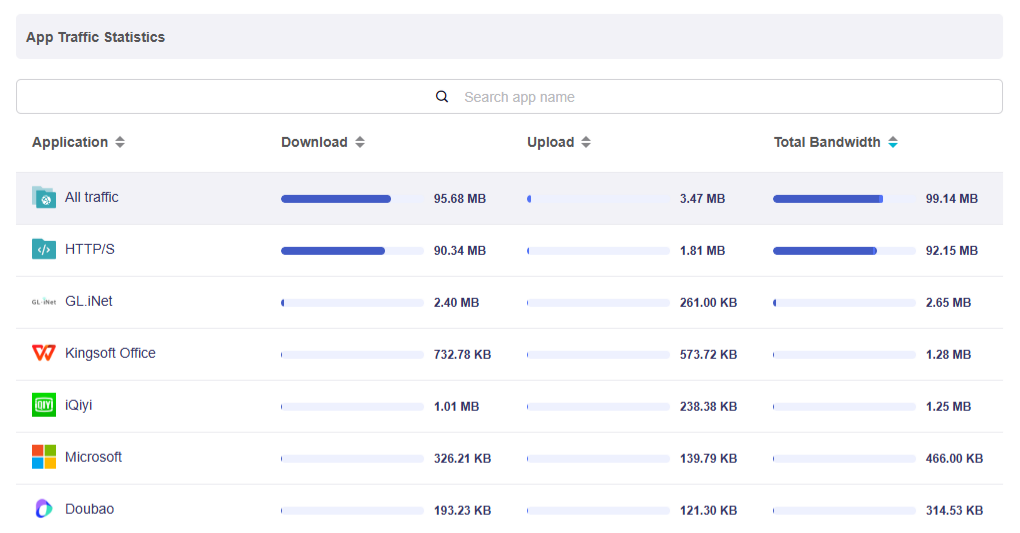
App Traffic Statistics: It displays detailed traffic metrics for each application, including Download, Upload, and Total Bandwidth. Search for specific apps in the search bar if required.
Click the sort arrow next to the column header to sort the list in ascending or descending order.
Data Storage Rules
-
Traffic statistics are saved to RAM every 15 seconds and stored in flash every 1 hour. Frequent flash writes are avoided to protect flash memory lifespan.
-
A soft reboot will not cause data loss. The system first writes data from RAM to flash before restarting.
-
A hard reboot (unplugging and replugging the power) or a firmware upgrade (retaining settings) may result in data loss of up to the most recent hour.
Switch Time Range
You can switch the time range between Past hour, Past day, and Past week as needed.
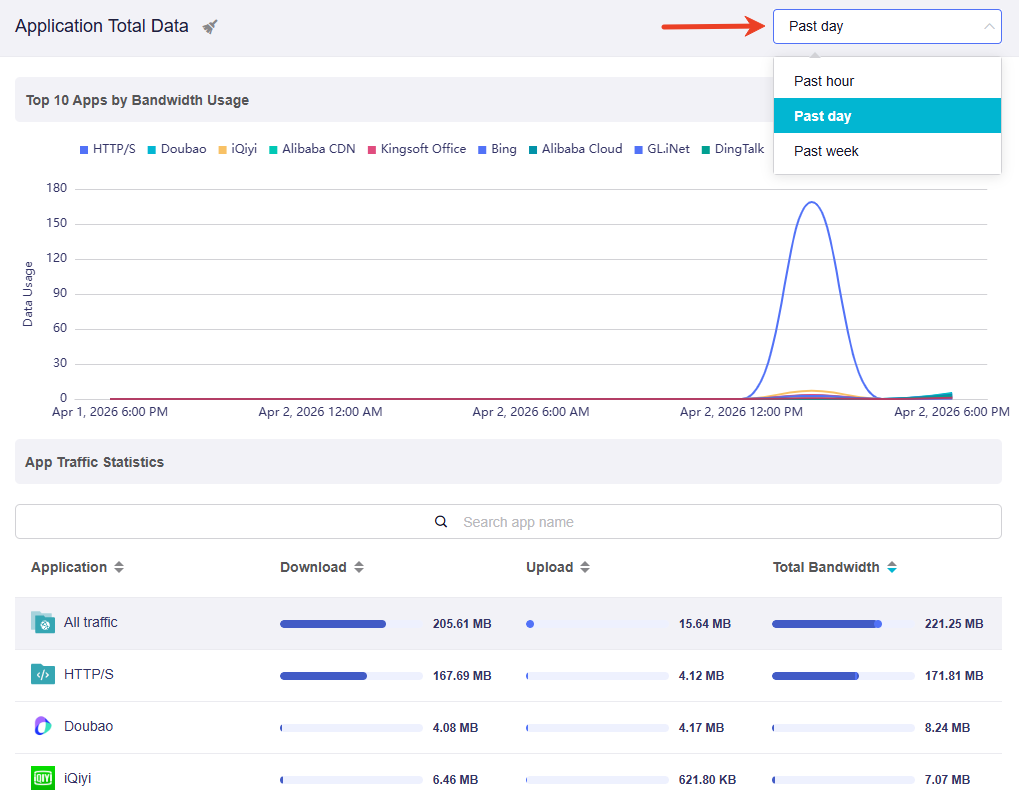
The time range you choose determines how the data is displayed:
-
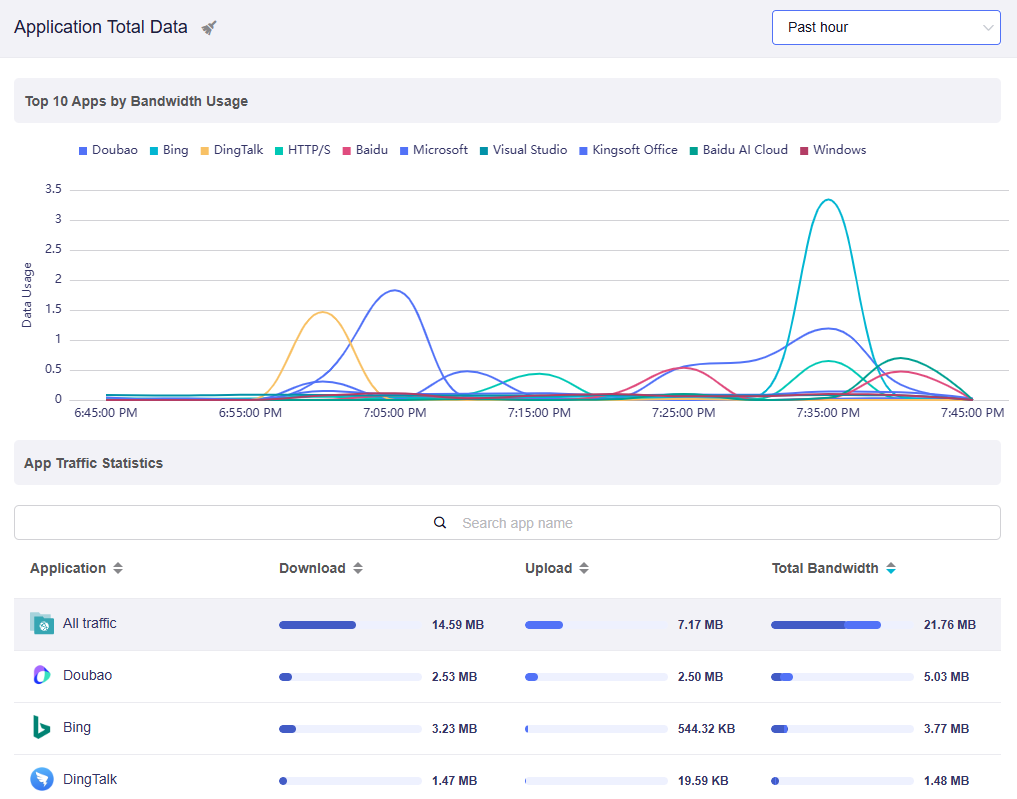
For a closer look (e.g., Past Hour): The chart shows fine-grained, real-time fluctuations. Peaks are taller and drops are steeper, making it easy to spot sudden spikes in bandwidth usage.
-
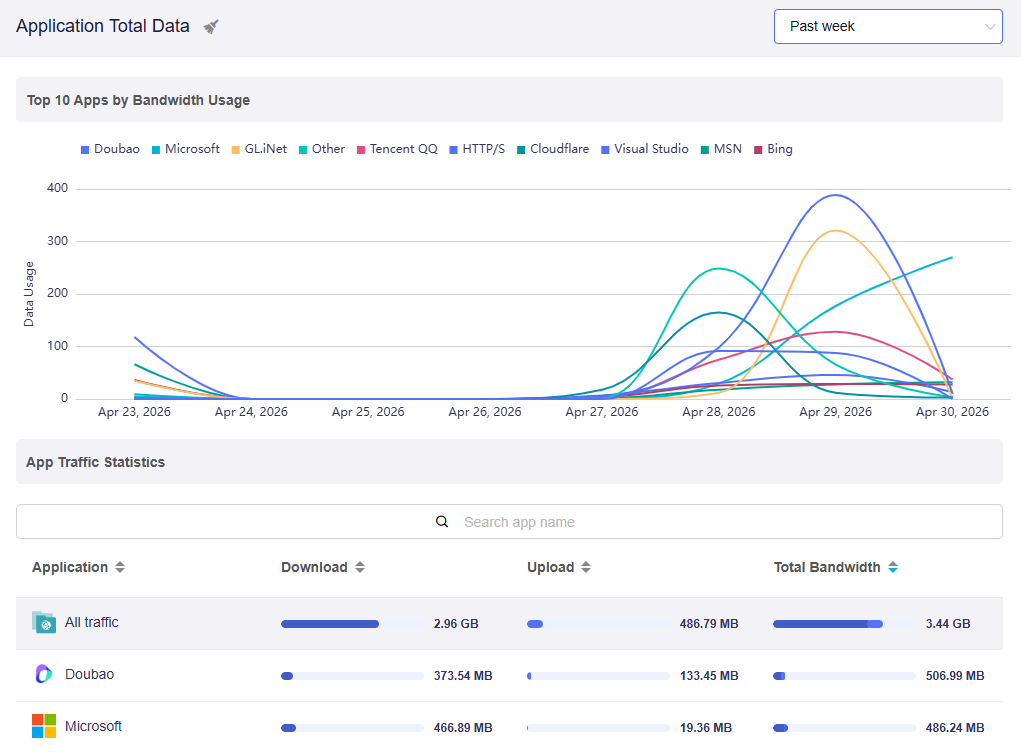
For a broad overview (e.g., Past Day or Past Week): The chart condenses the data into a longer timeline. The curves become smoother, showing the general traffic trend rather than every small change.
Clear Statistics
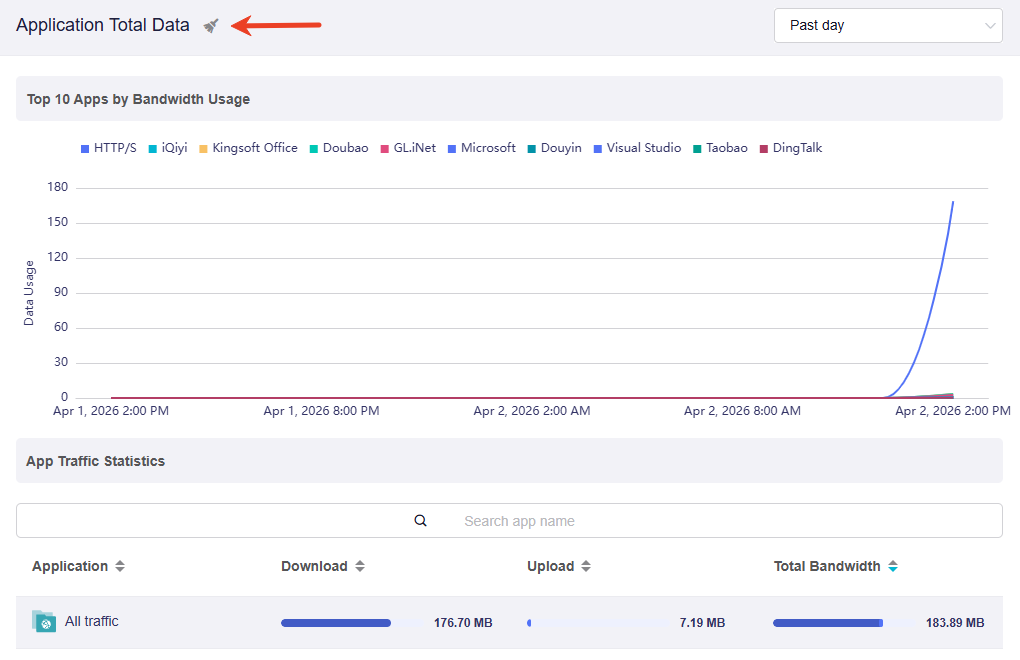
Click the broom icon in the upper left corner to clear statistics as needed.
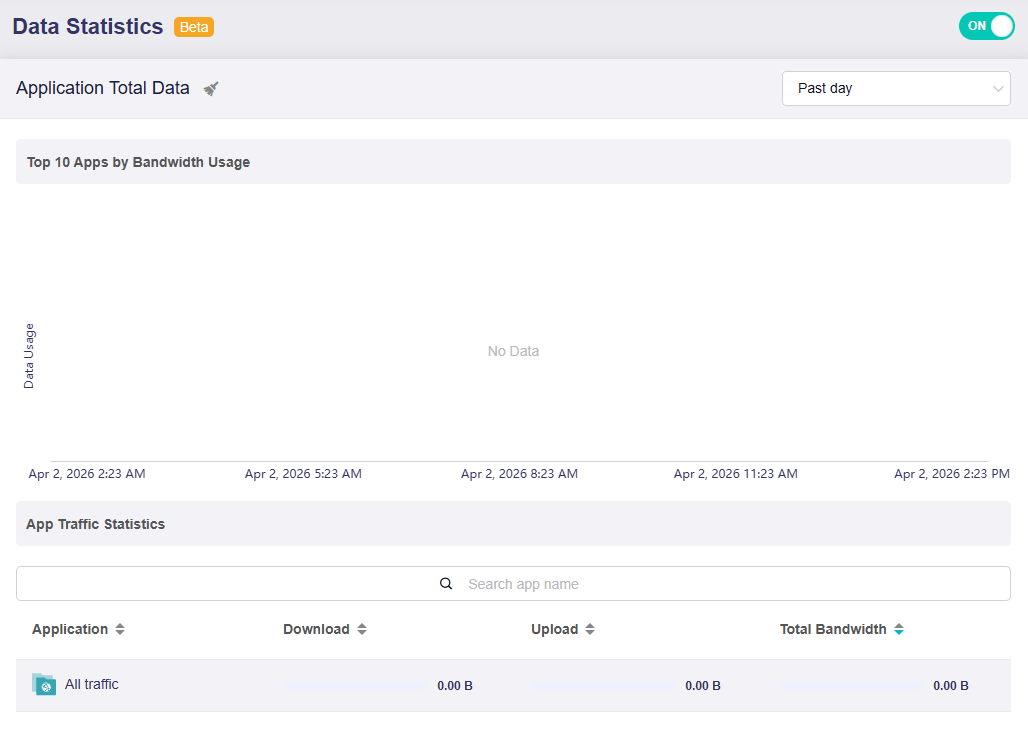
After clearing, the page will update as shown below. You may need to wait a moment for new statistics to start loading.
Still have questions? Visit our Community Forum or Contact us.